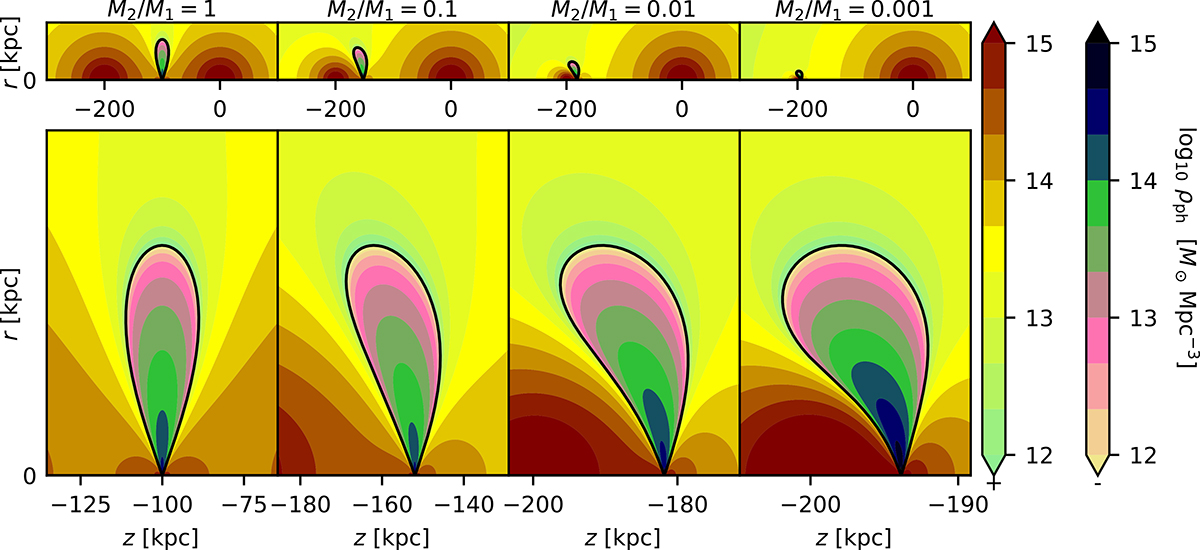
Fig. 5.
Download original image
Distribution of the PDM around two point masses (zero external field assumed) with various mass ratios indicated above each column. The mass of M1 is 1011 M⊙ and the two point masses are 200 kpc apart. The mass ratio is the same for each column. The top row shows the whole system, in the bottom row we can see magnified the region of the negative PDM. Note that the vertical ranges of the plots in the bottom row are different for each plot. In each plot, the r and z axes have the same scale.
Current usage metrics show cumulative count of Article Views (full-text article views including HTML views, PDF and ePub downloads, according to the available data) and Abstracts Views on Vision4Press platform.
Data correspond to usage on the plateform after 2015. The current usage metrics is available 48-96 hours after online publication and is updated daily on week days.
Initial download of the metrics may take a while.