Fig. 8.
Download original image
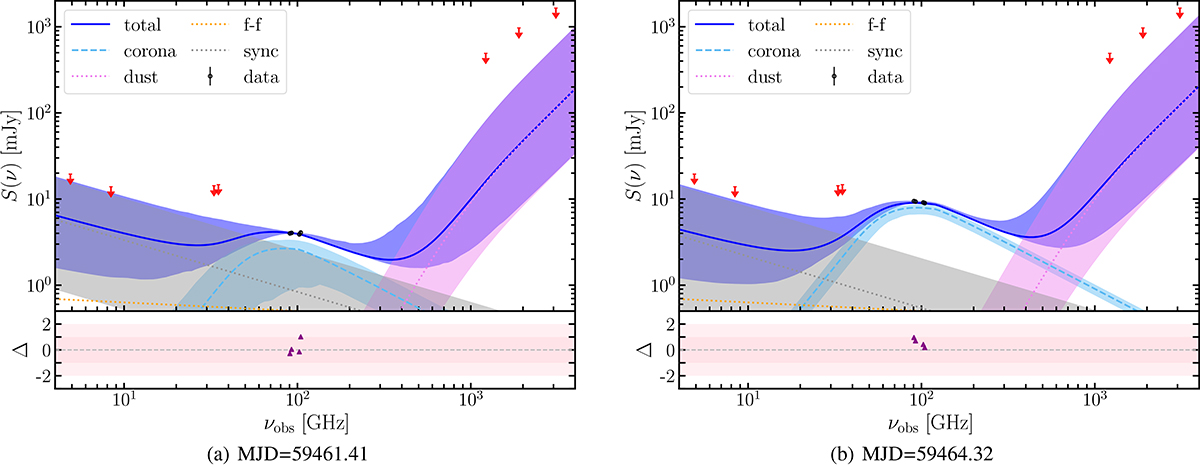
Multifrequency SED fitting of IC 4329A during the flux minimum and maximum. The black points represent the high-resolution ALMA data (this work), whereas the red arrows are the fluxes from low-resolution radio and infrared observations (Inoue & Doi 2018, and references therein), which in the context of the fitting procedure represent strict upper limits to the total flux coming from the nuclear region probed by ALMA. The different emission components in the model and their 1σ confidence intervals are marked, together with the total emission. The coronal component dominates the 100 GHz emission, and the diffuse synchrotron and dust emission components are poorly constrained. The bottom subpanels show the fitting residuals.
Current usage metrics show cumulative count of Article Views (full-text article views including HTML views, PDF and ePub downloads, according to the available data) and Abstracts Views on Vision4Press platform.
Data correspond to usage on the plateform after 2015. The current usage metrics is available 48-96 hours after online publication and is updated daily on week days.
Initial download of the metrics may take a while.