Fig. 7.
Download original image
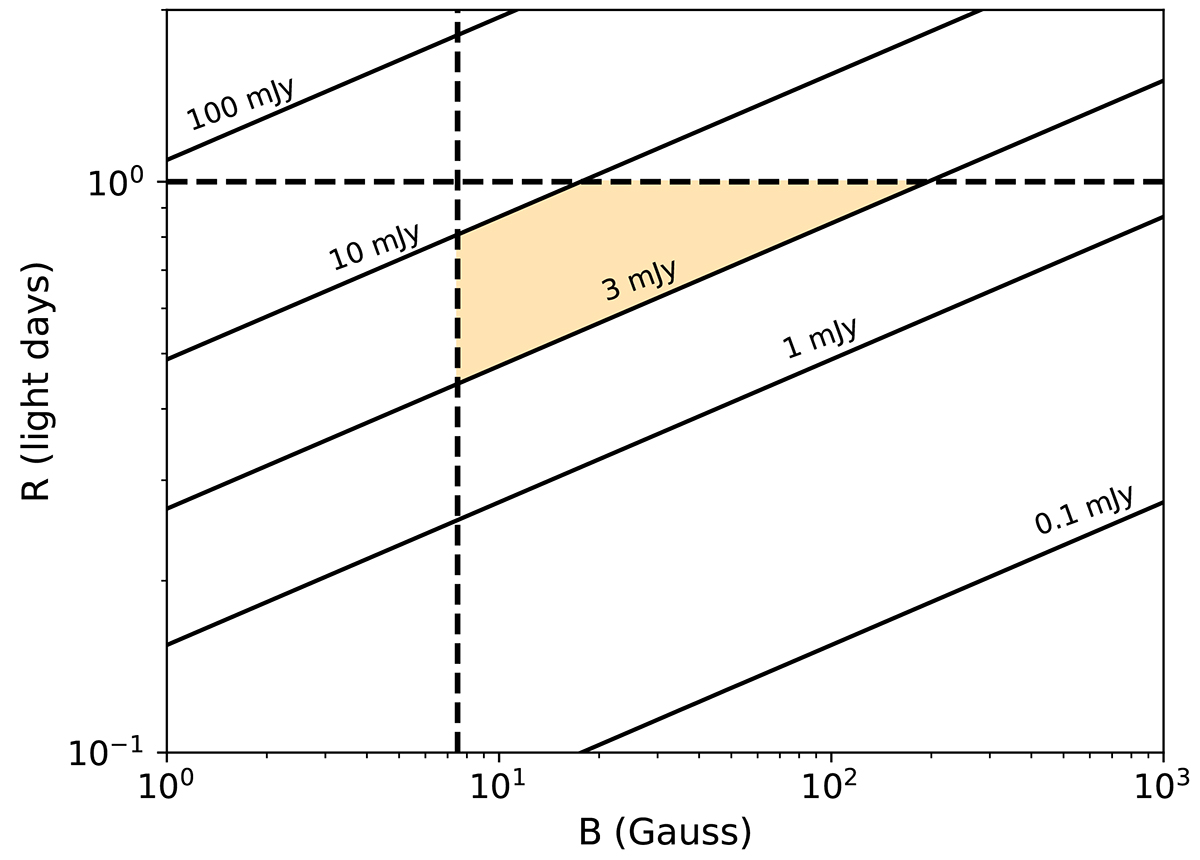
Dependence of the mm flux density at 100 GHz on the source size and magnetic field strength for z = 0.016. The dashed horizontal line illustrates the region of source sizes ≥1 ld. The dashed vertical line delineates the range where the magnetic field ≤Blim. The region between the refined values of R and B for the optically thick synchrotron regime and the observed flux of IC 4329A is highlighted in yellow.
Current usage metrics show cumulative count of Article Views (full-text article views including HTML views, PDF and ePub downloads, according to the available data) and Abstracts Views on Vision4Press platform.
Data correspond to usage on the plateform after 2015. The current usage metrics is available 48-96 hours after online publication and is updated daily on week days.
Initial download of the metrics may take a while.