Fig. 6.
Download original image
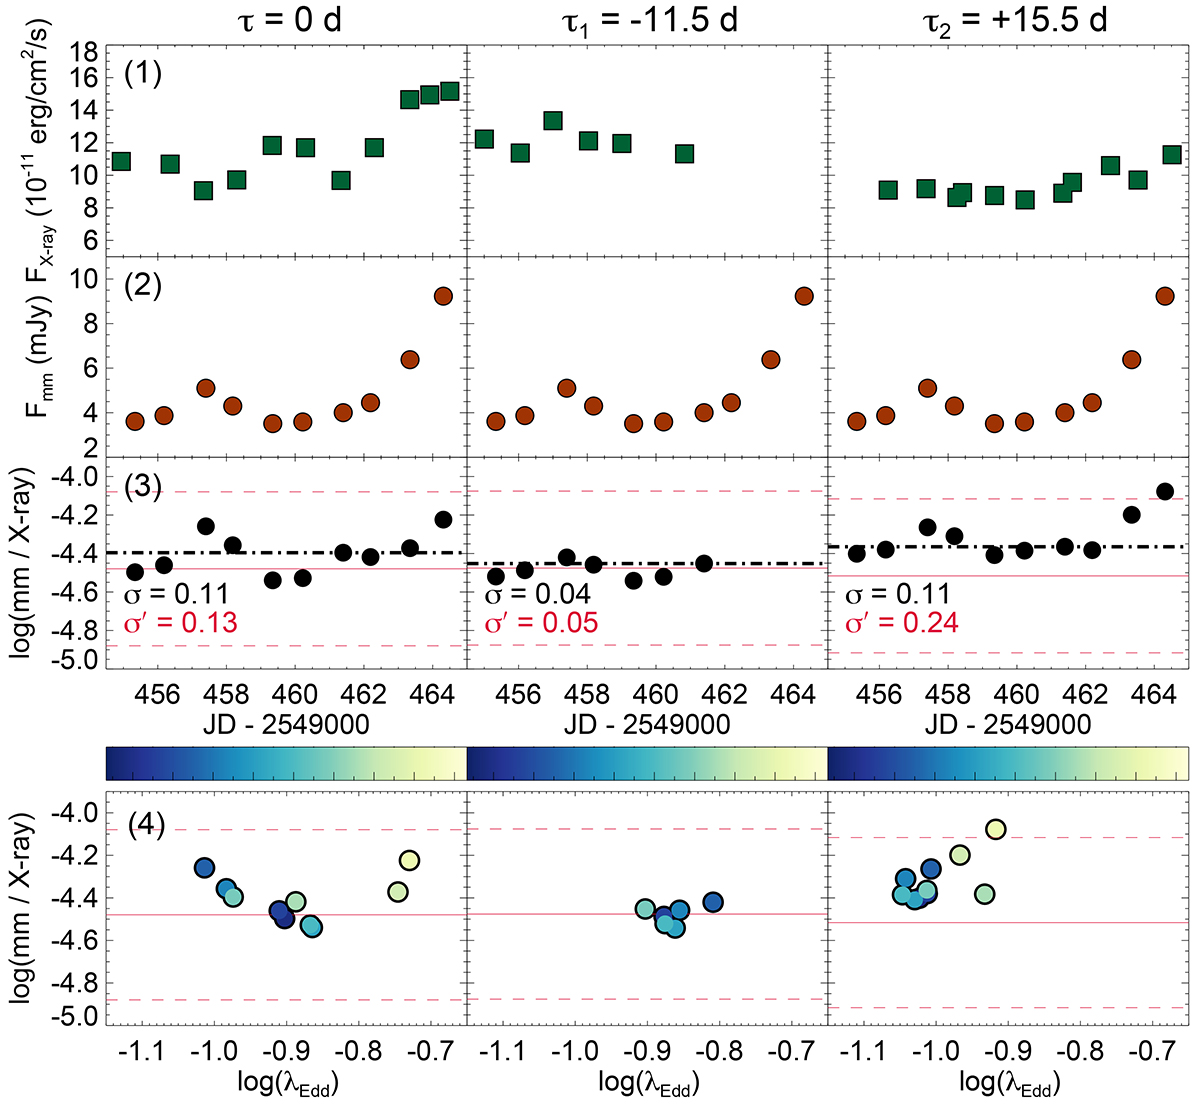
Variations of the mm/X-ray ratio during our observational campaign. The X-ray light curves shifted to the three time lags, τ = 0, −11.5, and +15.5 days (from left to right), are shown in panel (1), and the mm light curve is in panel (2). The ratio log(Fmm/FX − ray), where the X-ray light curve was interpolated to the ALMA epochs, is given in panel (3) for each of the time lags; the black dash-dotted line is the median value, and the red solid line corresponds to the relation between the 100 GHz and 2–10 keV fluxes from Ricci et al. (2023) with the 1σ scatter given by the dashed red lines. The IC 4329A epoch-to-epoch scatter (σ) is also presented in the figure: the scatter relative to the median is shown in black, while that relative to the predicted value is in red. Panel (4) contains the same values as panel (3), but as a function of the Eddington ratio λEdd. The color of the circles gives the date of the observation.
Current usage metrics show cumulative count of Article Views (full-text article views including HTML views, PDF and ePub downloads, according to the available data) and Abstracts Views on Vision4Press platform.
Data correspond to usage on the plateform after 2015. The current usage metrics is available 48-96 hours after online publication and is updated daily on week days.
Initial download of the metrics may take a while.