Fig. 5.
Download original image
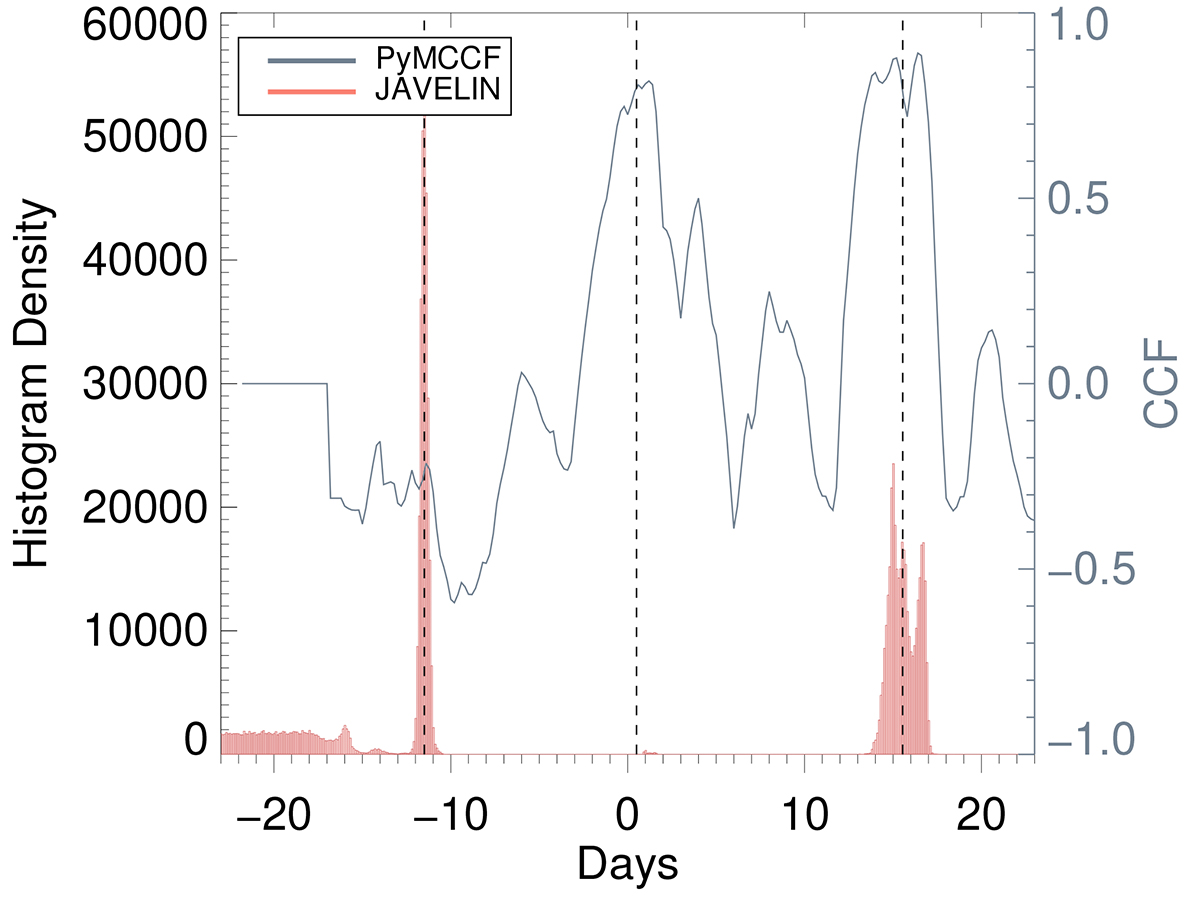
Results of the cross-correlation analysis of X-ray and mm data. The posterior distribution of the time lag provided by JAVELIN is illustrated by the red histogram. Two peaks at τ1 = −11.5 days (for the mm flux preceding the X-ray flux) and τ2 = 15.5 days are shown as vertical dashed lines. The result of PyMCCF is in gray with the 0.5-day time lag shown as a vertical dashed line.
Current usage metrics show cumulative count of Article Views (full-text article views including HTML views, PDF and ePub downloads, according to the available data) and Abstracts Views on Vision4Press platform.
Data correspond to usage on the plateform after 2015. The current usage metrics is available 48-96 hours after online publication and is updated daily on week days.
Initial download of the metrics may take a while.