Open Access
Fig. 3.
Download original image
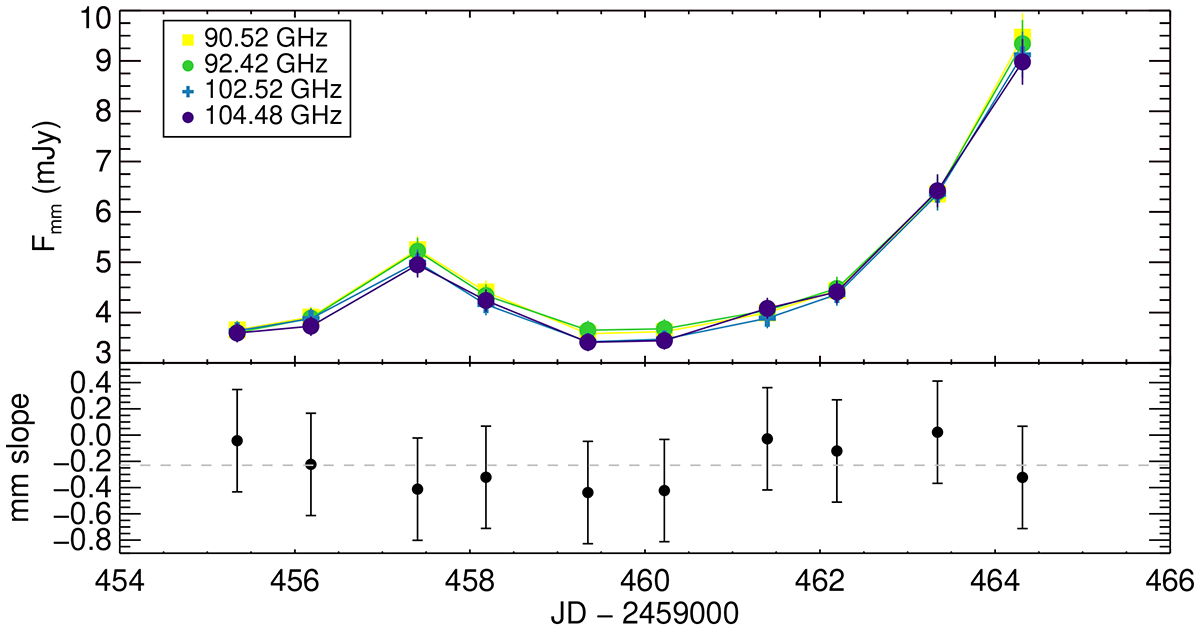
Variability of the mm flux and slope during the campaign. Upper panel: mm light curve in four different frequencies: 90.52, 92.42, 102.52, and 104.48 GHz, shown in different colors and symbols. Bottom panel: Variations in the mm spectral slope. The gray dashed line corresponds to the median spectral slope −0.23.
Current usage metrics show cumulative count of Article Views (full-text article views including HTML views, PDF and ePub downloads, according to the available data) and Abstracts Views on Vision4Press platform.
Data correspond to usage on the plateform after 2015. The current usage metrics is available 48-96 hours after online publication and is updated daily on week days.
Initial download of the metrics may take a while.