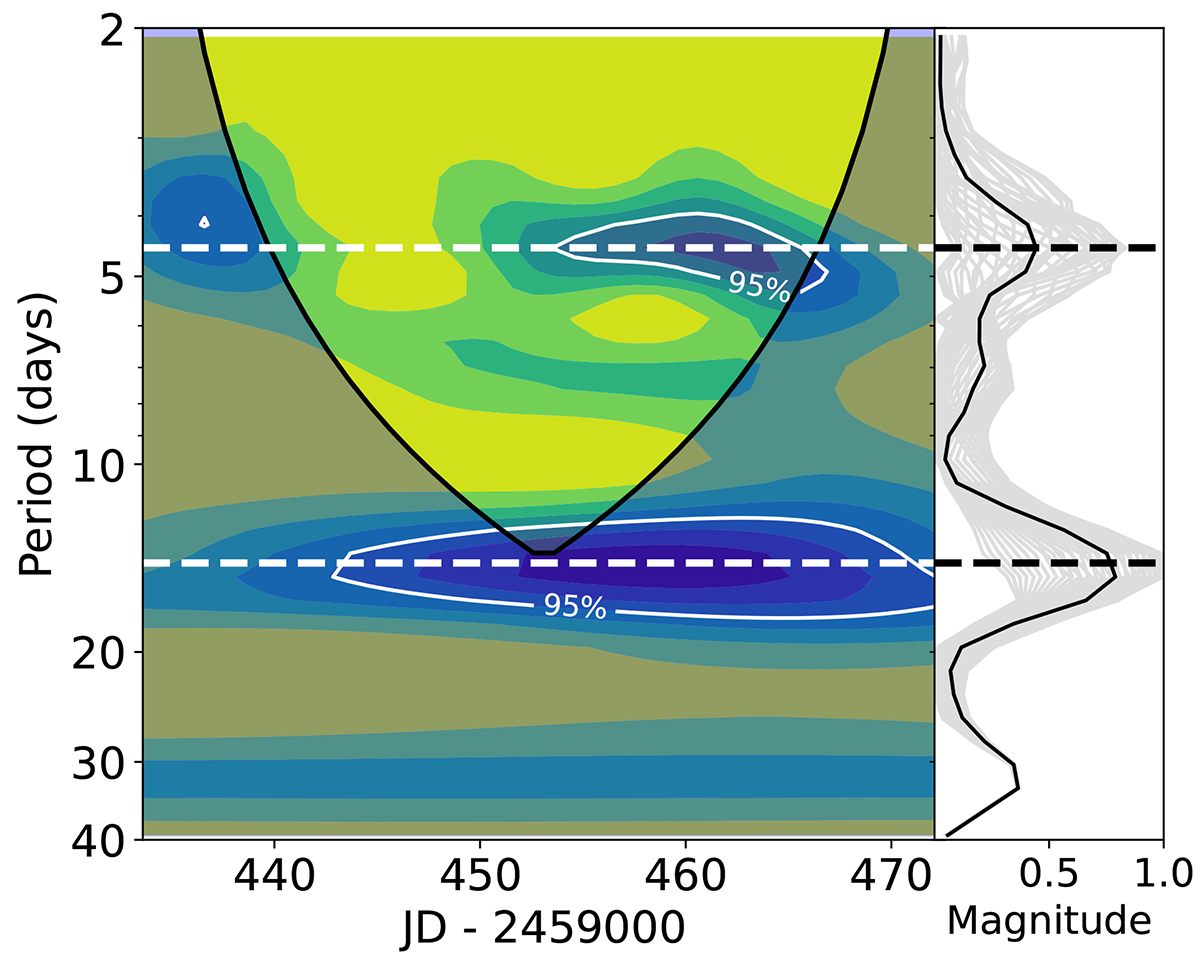
Fig. 2.
Download original image
Wavelet analysis of the X-ray variability with the trend subtracted and the data interpolated on the regular grid. Left: Magnitude of the wavelet transform. The 95% confidence level is given in white contours. The cone of influence is given as the solid black line; the region out of the cone in the darker color shows less reliable periods that may be affected by edge effects (see text for details). Right: Wavelet transform profiles in gray and their median value in black indicate the variability periods of 14.9 and 4.5 days. The dashed lines correspond to the maxima of the Lomb-Scargle periodogram.
Current usage metrics show cumulative count of Article Views (full-text article views including HTML views, PDF and ePub downloads, according to the available data) and Abstracts Views on Vision4Press platform.
Data correspond to usage on the plateform after 2015. The current usage metrics is available 48-96 hours after online publication and is updated daily on week days.
Initial download of the metrics may take a while.