Open Access
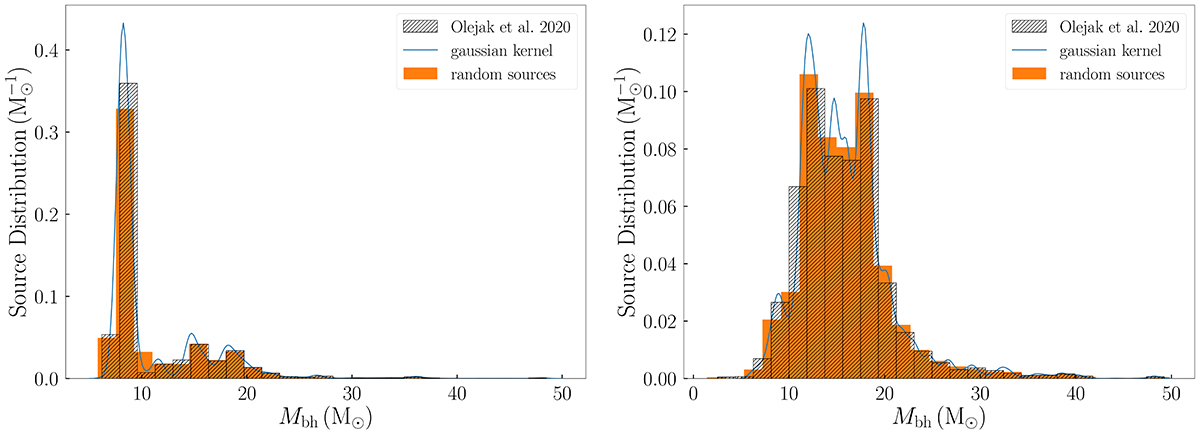
Fig. 4.
Download original image
Histogram of the masses of the BH of the qBHXBs. The shaded grey region is adopted from Olejak et al. (2020), from which we derive the Gaussian kernel shown by the solid line. The shaded orange histogram corresponds to 104 boxy bulge qBHXBs (left panel) and 1.2 × 10⁵ disc qBHXBs (right panel) used in this work.
Current usage metrics show cumulative count of Article Views (full-text article views including HTML views, PDF and ePub downloads, according to the available data) and Abstracts Views on Vision4Press platform.
Data correspond to usage on the plateform after 2015. The current usage metrics is available 48-96 hours after online publication and is updated daily on week days.
Initial download of the metrics may take a while.