Fig. 2.
Download original image
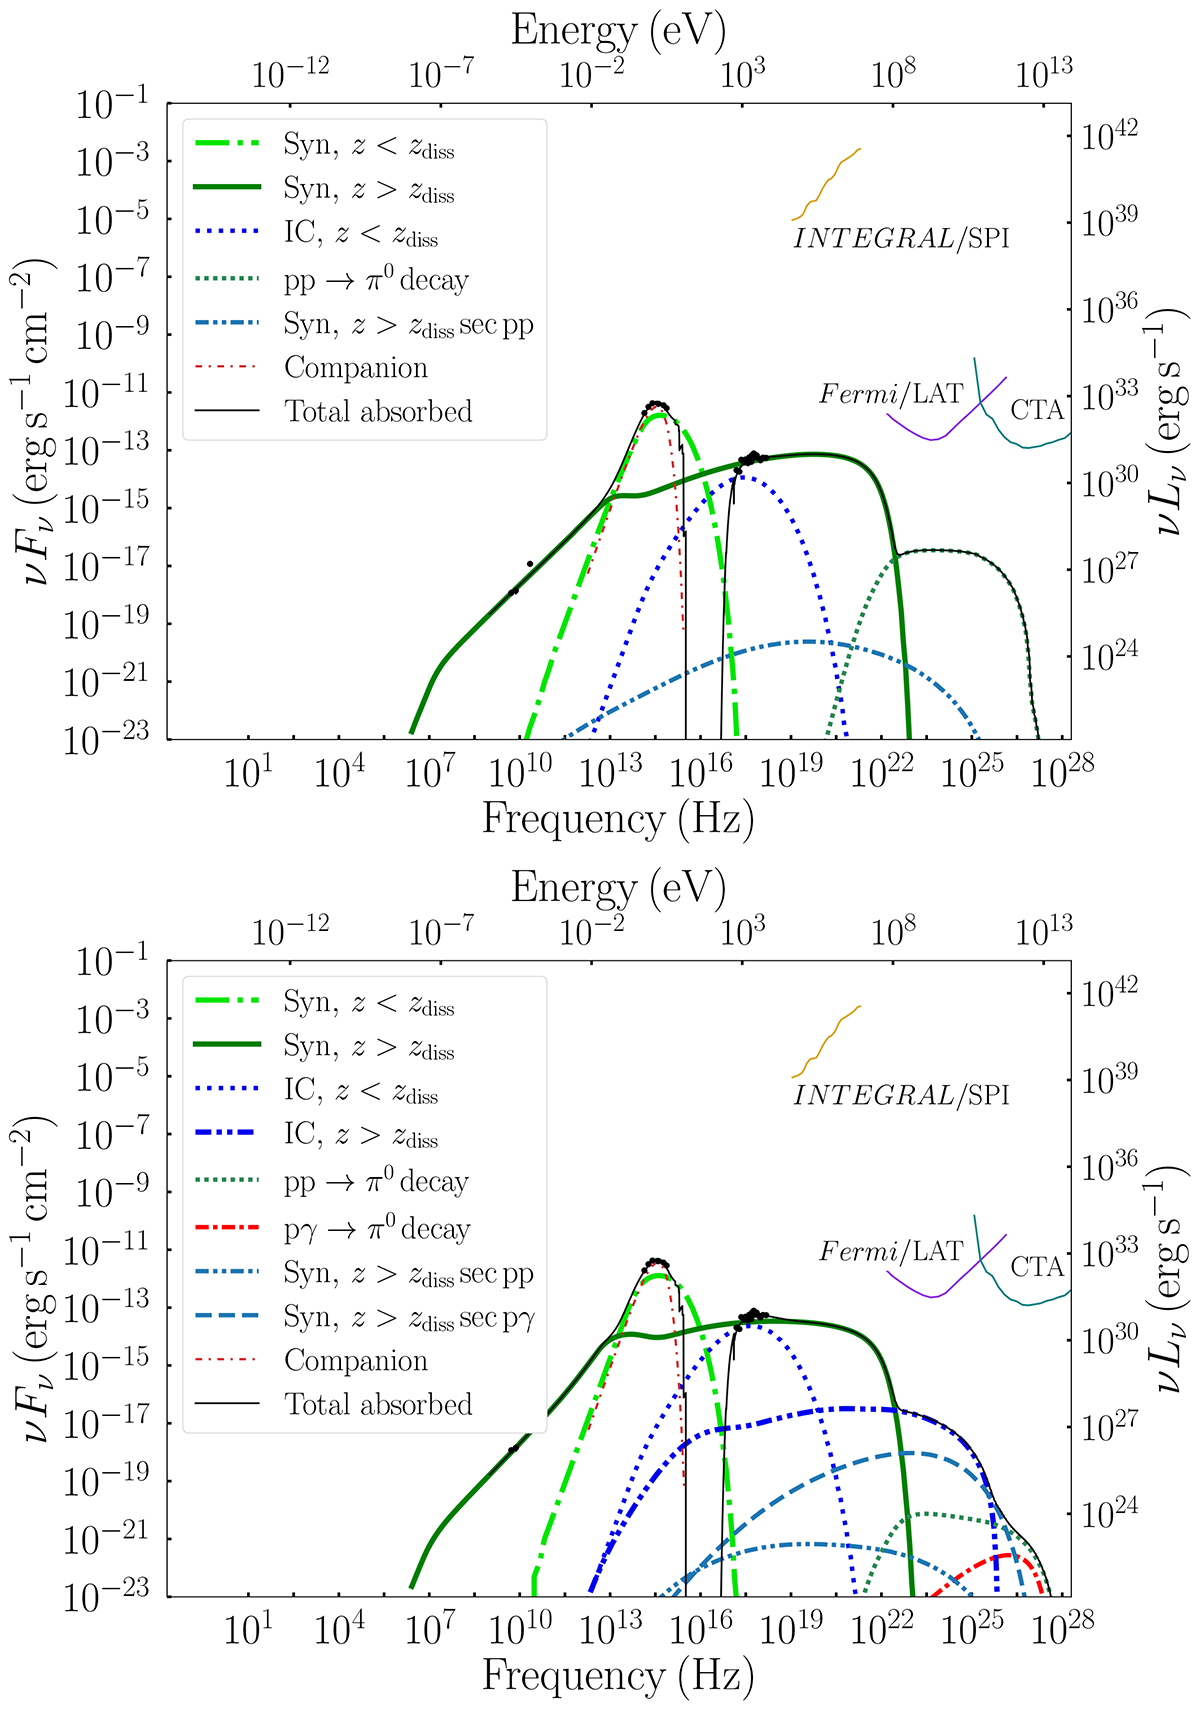
Multi-wavelength spectrum of A0620−00 for the case of the BHJet model in the upper panel and for the case of the MLJet model in the lower panel. The solid black line shows the total emitted spectrum, and the individual components are explained in the legends. The radio-to-X-ray data are the same as in Fig. 1. We include the INTEGRAL/SPI, Fermi/LAT, and CTAO point source sensitivities for comparison.
Current usage metrics show cumulative count of Article Views (full-text article views including HTML views, PDF and ePub downloads, according to the available data) and Abstracts Views on Vision4Press platform.
Data correspond to usage on the plateform after 2015. The current usage metrics is available 48-96 hours after online publication and is updated daily on week days.
Initial download of the metrics may take a while.