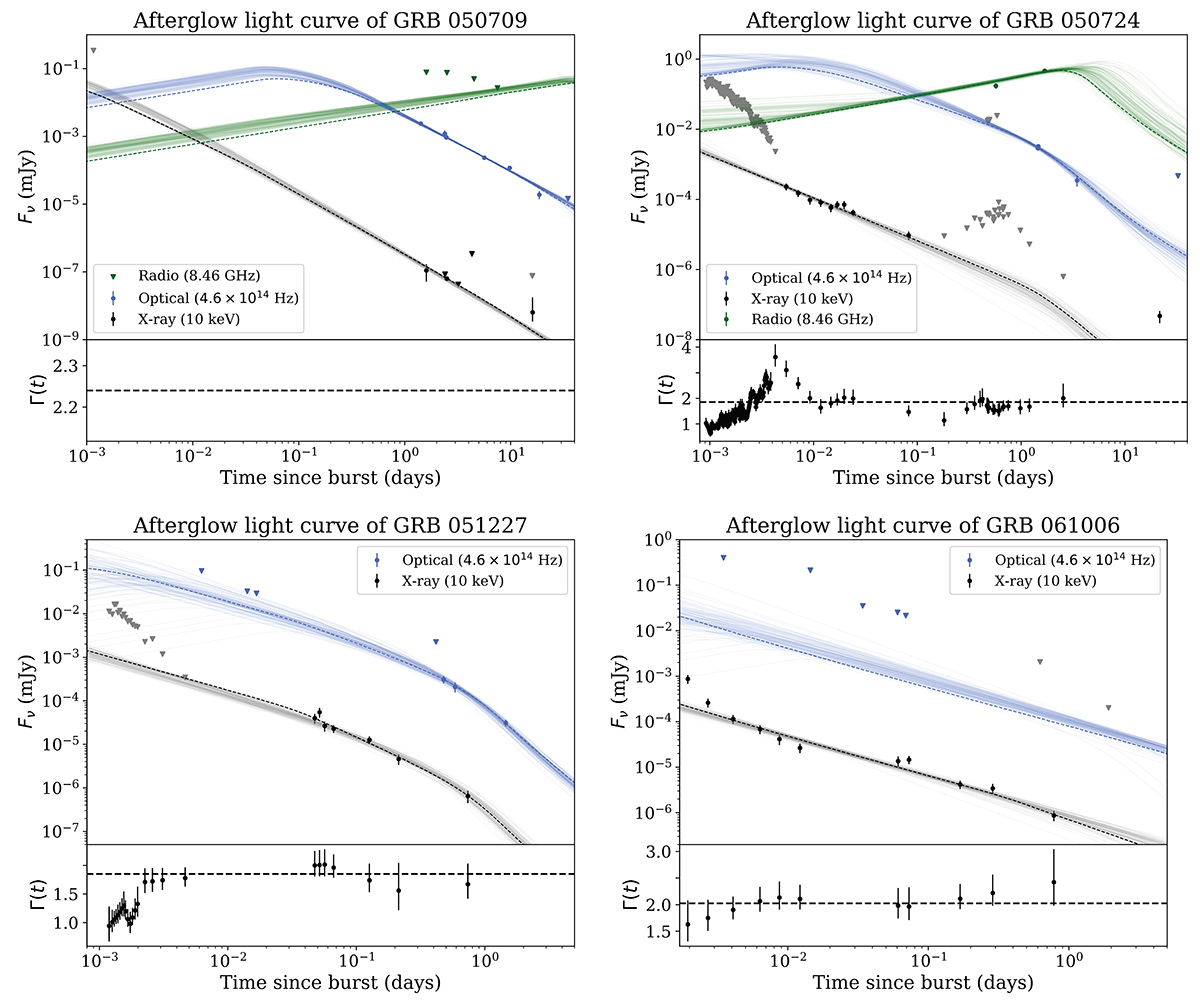
Fig. C.1.
Download original image
Fits to the broadband light curves of the 13 merger-induced GRB afterglows in the final sample. The upper panel shows the flux density as a function of time since the GRB trigger. Black, blue and green points represent X-ray, optical, and radio detections, respectively; coloured triangles denote true upper limits, while grey triangles represent detections that were treated as upper limits in the fitting procedure as they were deemed to be caused by another emission process than the standard forward shock afterglow emission. Dashed lines mark the best fit (maximum a posteriori) to the data, accompanied by a hundred samples randomly drawn from the posterior flux density distribution within the 16th – 84th percentile range to visualise the uncertainty region. The bottom panel shows the evolution of the photon index of the X-ray spectrum, ΓX(t), also taken from the Swift Light Curve Repository. For GRB 050709 and GRB 160821B, all X-ray data were taken from other authors rather than from the Swift Light Curve Repository, such that the evolution of the photon index is not shown.
Current usage metrics show cumulative count of Article Views (full-text article views including HTML views, PDF and ePub downloads, according to the available data) and Abstracts Views on Vision4Press platform.
Data correspond to usage on the plateform after 2015. The current usage metrics is available 48-96 hours after online publication and is updated daily on week days.
Initial download of the metrics may take a while.