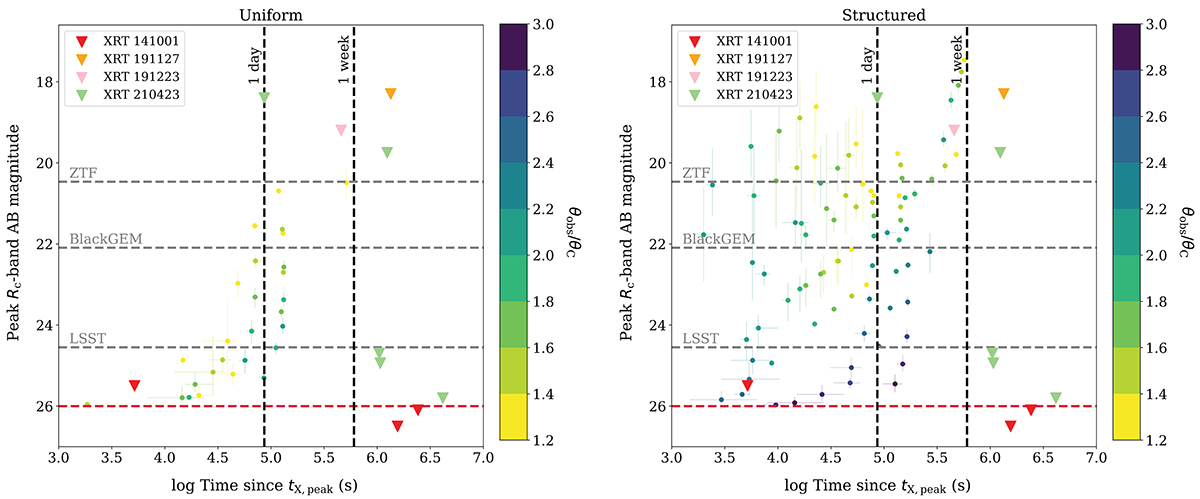
Fig. 3.
Download original image
Peak R-band AB magnitude of the optical afterglows of off-axis merger-induced GRBs in the sample seen from different viewing angles θobs/θC (coloured points), as a function of the time between the peak of the X-ray afterglow and the time when the optical afterglow vanishes below the magnitude limit mlim = 26 (red dashed line). Coloured triangles denote VLT/VIMOS, VLT/FORS2, and Gemini/GMOS-S R-band upper limits of XRT 141001 (Luo et al. 2014; Treister et al. 2014a,b; Bauer et al. 2017) and ZTFR-band upper limits of XRT 191127, XRT 191223, and XRT 210423 (Quirola-Vásquez et al. 2023), and additional upper limits for XRT 210423 measured by VLT/FORS2, GTC/HiPERCAM, Hale Telescope/WaSP, and LBT/LBC (Andreoni et al. 2021b; Rossi et al. 2021; Eappachen et al. 2023; Quirola-Vásquez et al. 2024). Grey dashed lines mark the R-band limiting magnitudes of ZTF (mlim = 20.5), BlackGEM (mlim = 22.1) and LSST (mlim = 24.5). Results on the left correspond to the uniform-jet models of the GRB sample, while those on the right correspond to the structured-jet model with θW = 2θC. We note that the four GRBs with large uncertainties in their peak magnitude in the case of a structured jet with θobs ≤ θW correspond to those four GRBs that have large uncertainties in their peak X-ray luminosity as well (see Sect. 4.1).
Current usage metrics show cumulative count of Article Views (full-text article views including HTML views, PDF and ePub downloads, according to the available data) and Abstracts Views on Vision4Press platform.
Data correspond to usage on the plateform after 2015. The current usage metrics is available 48-96 hours after online publication and is updated daily on week days.
Initial download of the metrics may take a while.