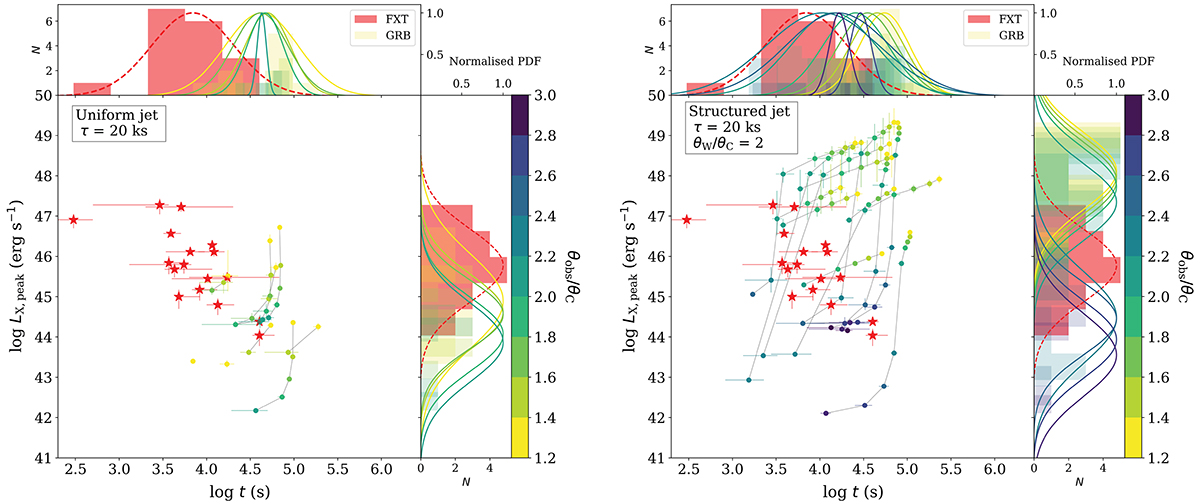
Fig. 1.
Download original image
Peak X-ray luminosities LX, peak in the 0.3–10 keV band, and durations T90 (Table B.1) of distant FXTs (red stars) and durations t above the assumed flux limit of off-axis merger-induced GRB X-ray afterglows (coloured points). The latter is shown for different viewing angles θobs/θC. The histograms show the sample distributions of the luminosity and duration of FXTs on one hand and GRBs on the other hand; over-plotted on the histograms are the corresponding normalised probability densities (red dashed lines and coloured solid lines corresponding to the sample of FXTs and GRBs, respectively) showing how the distributions of the peak X-ray luminosity and duration shift with increasing viewing angle (θobs/θC). Results on the left correspond to the uniform-jet model, and those on the right to the structured-jet model with θW = 2θC.
Current usage metrics show cumulative count of Article Views (full-text article views including HTML views, PDF and ePub downloads, according to the available data) and Abstracts Views on Vision4Press platform.
Data correspond to usage on the plateform after 2015. The current usage metrics is available 48-96 hours after online publication and is updated daily on week days.
Initial download of the metrics may take a while.