Fig. A.1.
Download original image
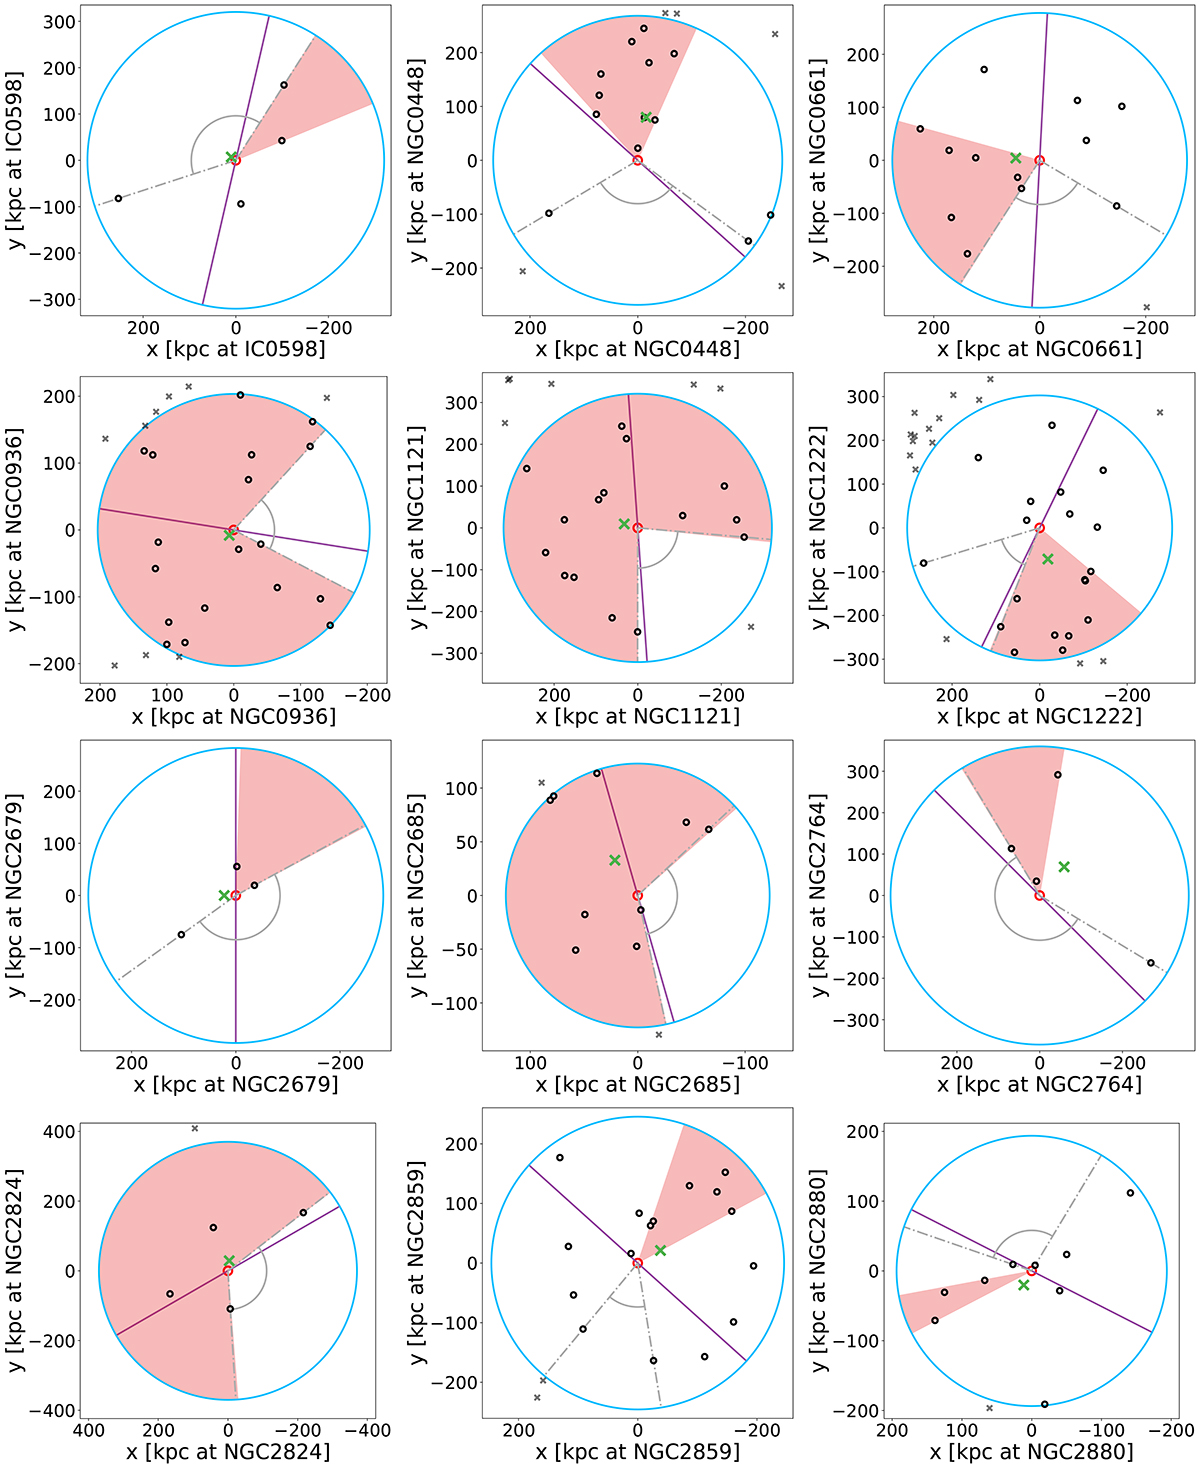
Satellite distributions around the isolated ETGs from the MATLAS survey. The blue circle is the largest circle centered on the ETG that fits in the 1 deg2 FoV. Black circles are satellites within the blue circle. Gray crosses are satellites outside the circle but still within the FoV. The red circle is ETG. The purple line is the maximum hemisphere separation. The green cross is the centroid of satellite distribution. The two gray dotted lines, along with the gray arc show the largest wedge without any satellites. The red-shaded wedge hosts the most unusually high population of satellites compared to the isotropic realizations in the MC simulation.
Current usage metrics show cumulative count of Article Views (full-text article views including HTML views, PDF and ePub downloads, according to the available data) and Abstracts Views on Vision4Press platform.
Data correspond to usage on the plateform after 2015. The current usage metrics is available 48-96 hours after online publication and is updated daily on week days.
Initial download of the metrics may take a while.