Fig. 5.
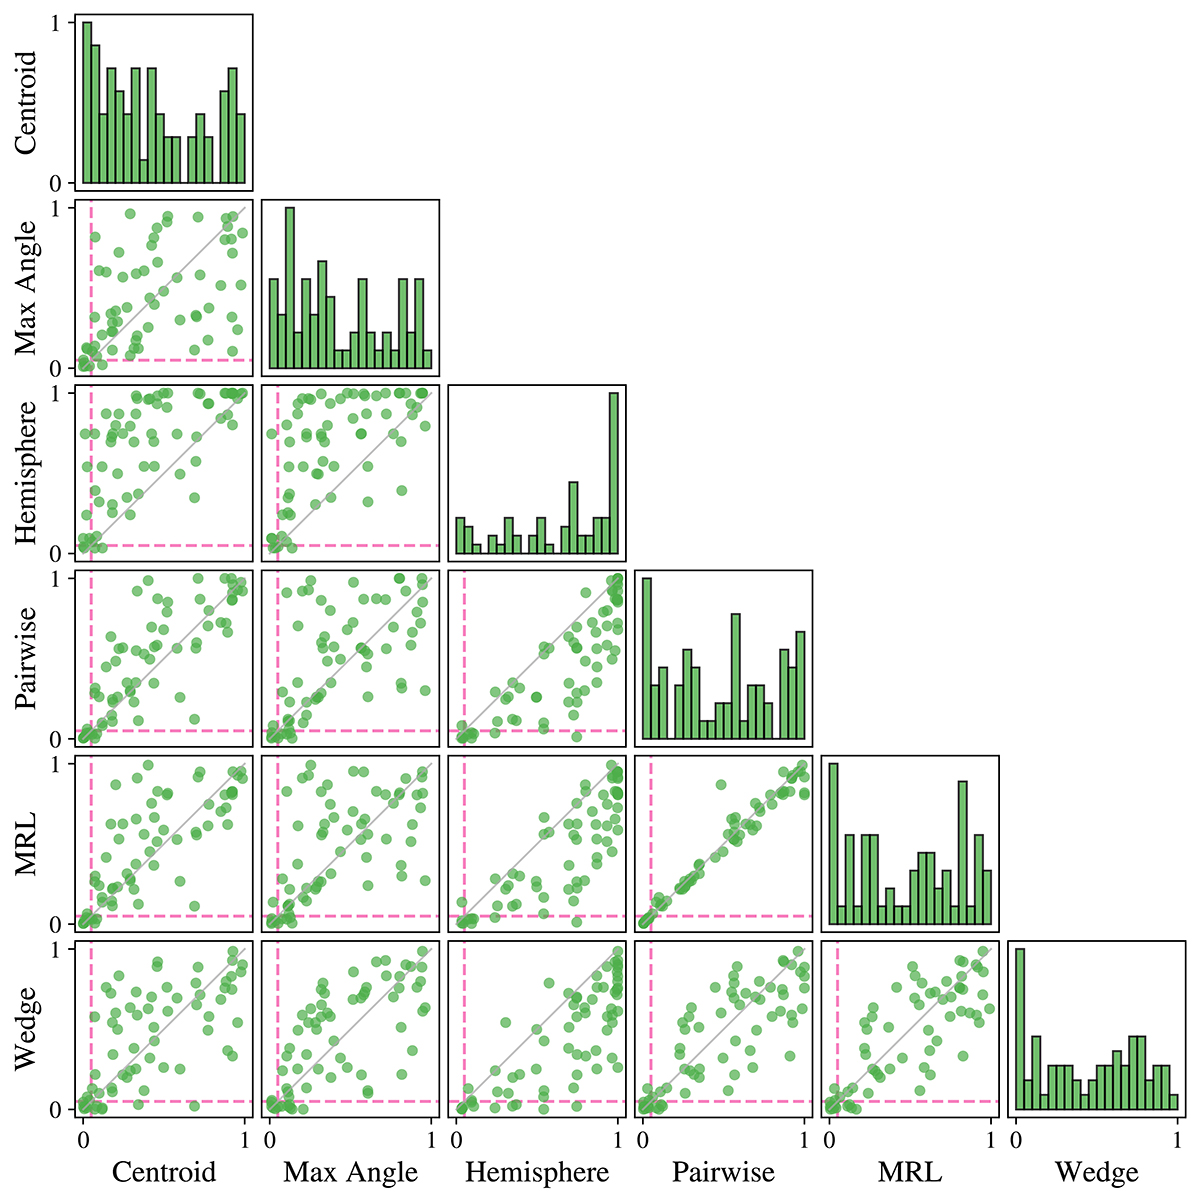
Download original image
Relationships between the p-values of the six applied metrics on all systems. Each off-diagonal subplot illustrates the p-values for a pair of metrics. The dashed pink lines show the α = 0.05 significance threshold to indicate statistically significant lopsidedness under either or both metrics. The diagonal gray line shows the one-to-one relation. The on-diagonal subplots show the normalized p-value distributions under the different metrics. The bin size was chosen to be 0.05 in line with the significance threshold. For this plot, we only consider systems with at least three satellites.
Current usage metrics show cumulative count of Article Views (full-text article views including HTML views, PDF and ePub downloads, according to the available data) and Abstracts Views on Vision4Press platform.
Data correspond to usage on the plateform after 2015. The current usage metrics is available 48-96 hours after online publication and is updated daily on week days.
Initial download of the metrics may take a while.