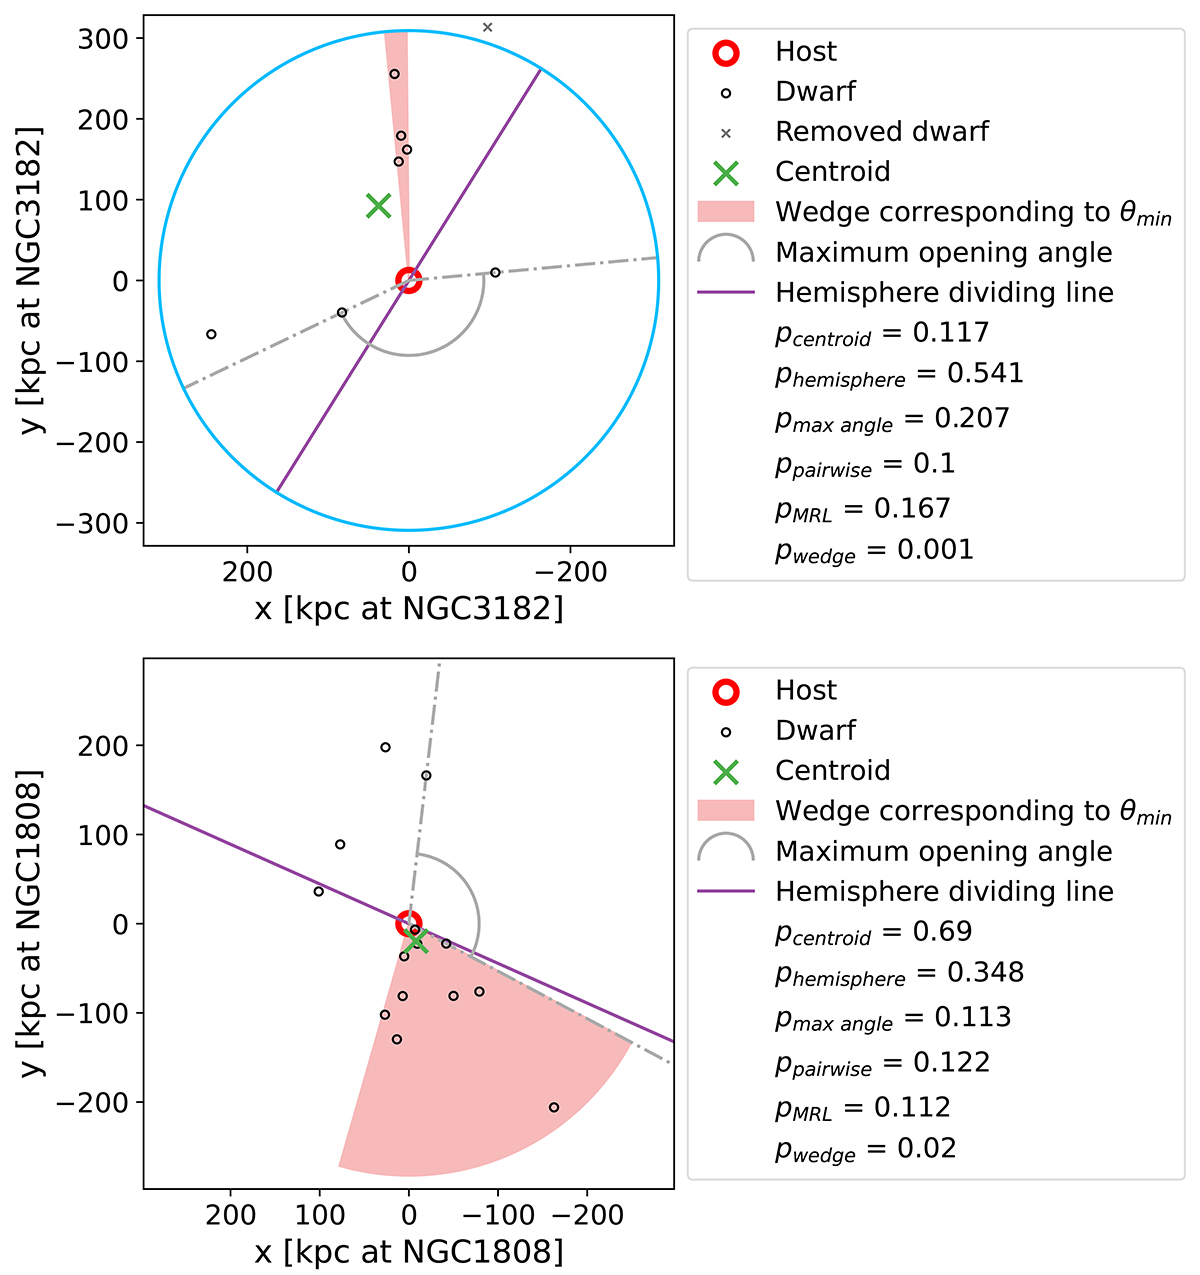
Fig. 4.
Download original image
Illustration of different behaviors of the six tested metrics on the same systems. We show one example from the MATLAS hosts (NGC3182, top) and one from the ELVES sample (NGC1808, bottom). The satellite systems are shown in a coordinate system with the respective host (red circle) at the origin and the satellites (black circle) at the projected relative distance in kpc from the host. The blue circle in the MATLAS field shows the largest possible circle centered on the host that fits into the MATLAS FoV. We exclude dwarfs beyond this circle (gray cross) due to possible radial incompleteness. The green cross marks the centroid of the satellite system. The shaded red area is the wedge containing the most unusually high number of dwarfs compared to the respective randomized systems. The gray arc shows the maximum opening angle in the system that is devoid of satellites. The purple line illustrates the most extreme possible hemisphere dividing line. We further show the p-values under the six different metrics.
Current usage metrics show cumulative count of Article Views (full-text article views including HTML views, PDF and ePub downloads, according to the available data) and Abstracts Views on Vision4Press platform.
Data correspond to usage on the plateform after 2015. The current usage metrics is available 48-96 hours after online publication and is updated daily on week days.
Initial download of the metrics may take a while.