Fig. 2.
Download original image
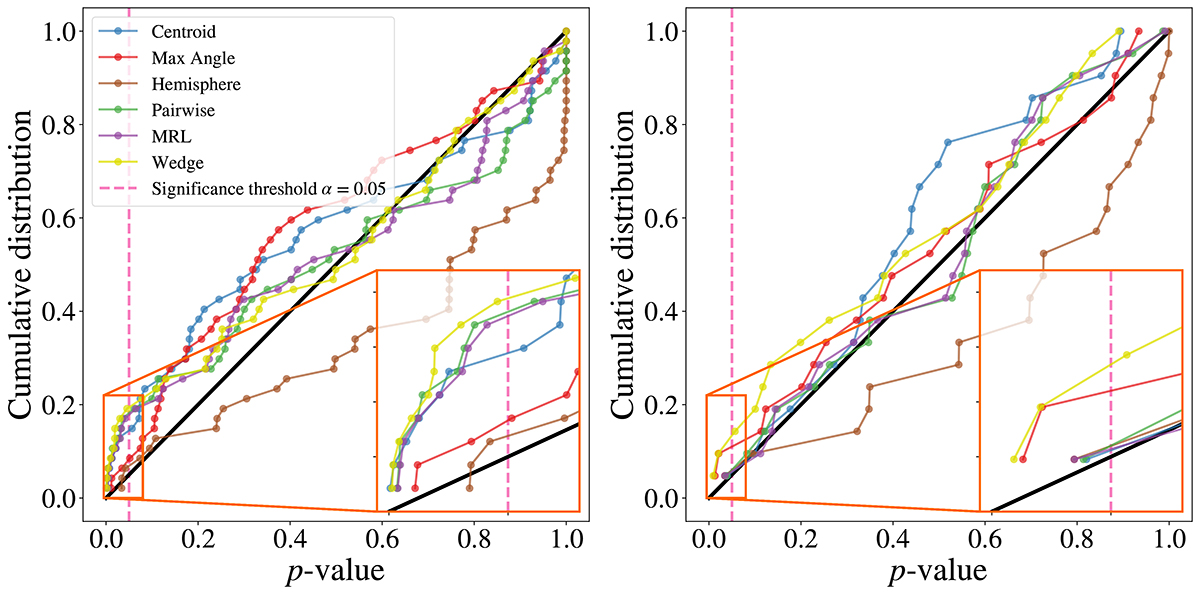
Cumulative p-value distributions for the different metrics of lopsidedness applied to the isolated MATLAS (left) and ELVES (right) host environments. All p-values were calibrated from the comparison with 105 isotropic satellite distributions, which have the same number of satellites and the same radial distribution as the dwarfs in the data. The dashed pink lines mark the significance threshold of 0.05. The orange boxes zoom in on significant regions. The diagonal black lines show the expected distribution from random isotropic systems.
Current usage metrics show cumulative count of Article Views (full-text article views including HTML views, PDF and ePub downloads, according to the available data) and Abstracts Views on Vision4Press platform.
Data correspond to usage on the plateform after 2015. The current usage metrics is available 48-96 hours after online publication and is updated daily on week days.
Initial download of the metrics may take a while.