Fig. A.3.
Download original image
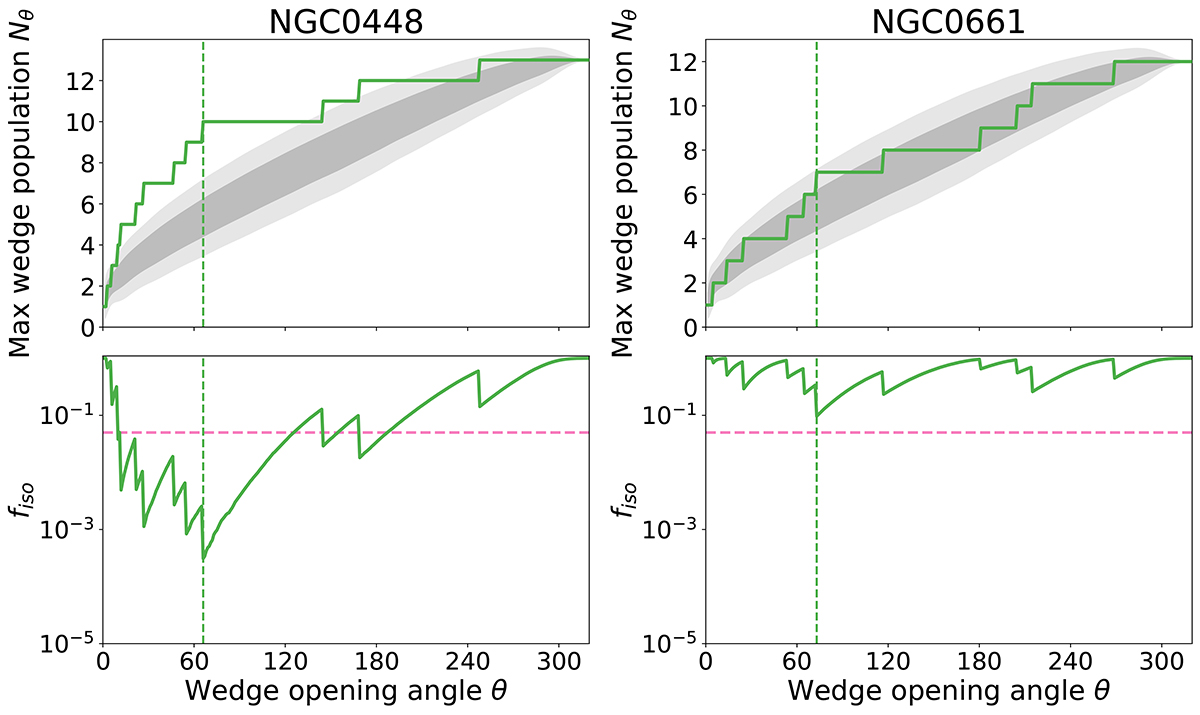
Maximum wedge population Nθ (top) and isotropic frequency fiso (bottom) versus the wedge opening angle θ for two examples from the MATLAS survey. Top: the green solid line shows the wedge populations in the observed systems. The gray-shaded areas illustrate the results of the 105 isotropically distributed satellite systems with the same number of observed satellites. The dark and light gray areas mark the 1σ and 2σ intervals of the MC realizations, respectively. The green dashed vertical lines mark the wedge opening angles for which the observed systems show an unusually high satellite population compared to the isotropic random realizations. Bottom: the green solid lines show the frequency fiso (logarithmic scale) at which a given wedge opening angle is equally or more populated in isotropic systems as it is in the observed one. The pink dashed horizontal lines show the significance threshold α = 0.05. Thus the dwarf configuration around NGC0448 (left) is found to be statistically significant. The one around NGC0661 (right) is not significantly unusual as the isotropic frequency does not dip below the 0.05 threshold. We extract the individual p-values for the specific observed configuration with these graphs. The overall meta-p-value for a given system is determined after repeating this procedure for all isotropic random systems and comparing the resulting p-values.
Current usage metrics show cumulative count of Article Views (full-text article views including HTML views, PDF and ePub downloads, according to the available data) and Abstracts Views on Vision4Press platform.
Data correspond to usage on the plateform after 2015. The current usage metrics is available 48-96 hours after online publication and is updated daily on week days.
Initial download of the metrics may take a while.