Fig. 1.
Download original image
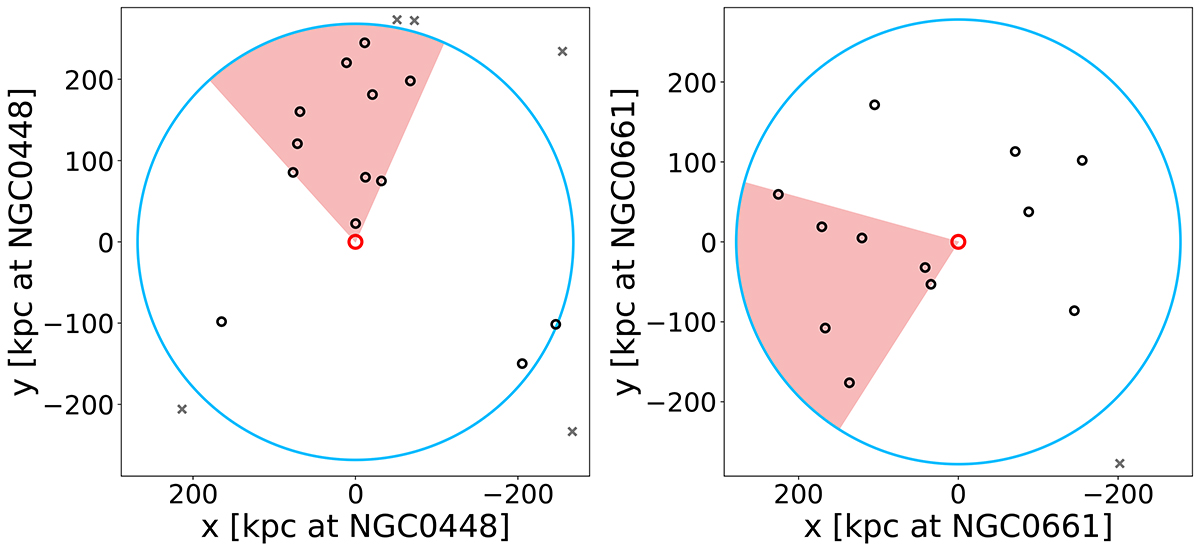
Wedge metric applied to two example fields from the MATLAS survey. We plot the systems in a coordinate system with the host (red circle) at the origin. The blue circle illustrates the biggest possible circle around the targeted ETG that fits into the MATLAS FoV. The dwarf satellites (black circles) within this blue region were analyzed in this work, and the ones that fall outside (gray crosses) were discarded to avoid possible radial incompleteness. A wedge, shown as the red-shaded area, was rotated around the host galaxy with increasing opening angles after every rotation. We counted the maximum satellite population, Nθ, and wedge orientation at every opening angle. The corresponding graphs for these systems are shown in Figure A.3. The red-shaded areas show the wedges that feature the most unusually high number of satellites when compared to isotropic systems. Left: Satellite system NGC0448. Due to the high degree of angular clustering along with the small number of outliers, this configuration is statistically significant under the wedge metric (p = 0.002). Right: System around NGC0661. This system is less unusual compared to isotropic realizations (p = 0.320).
Current usage metrics show cumulative count of Article Views (full-text article views including HTML views, PDF and ePub downloads, according to the available data) and Abstracts Views on Vision4Press platform.
Data correspond to usage on the plateform after 2015. The current usage metrics is available 48-96 hours after online publication and is updated daily on week days.
Initial download of the metrics may take a while.