Open Access
Fig. 9.
Download original image
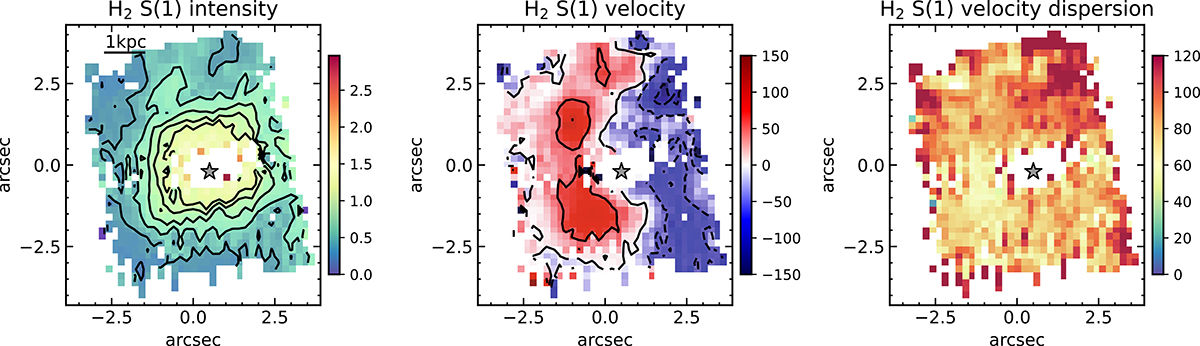
Maps of H2 S(1) at λrest = 17.03 μm observed in ch3. Panels and symbol are as in Fig. 5. The 0,0 point on the axes refers to the center of this sub-channel array, after rotation. In all maps, north is up and east to the left.
Current usage metrics show cumulative count of Article Views (full-text article views including HTML views, PDF and ePub downloads, according to the available data) and Abstracts Views on Vision4Press platform.
Data correspond to usage on the plateform after 2015. The current usage metrics is available 48-96 hours after online publication and is updated daily on week days.
Initial download of the metrics may take a while.