Fig. 3.
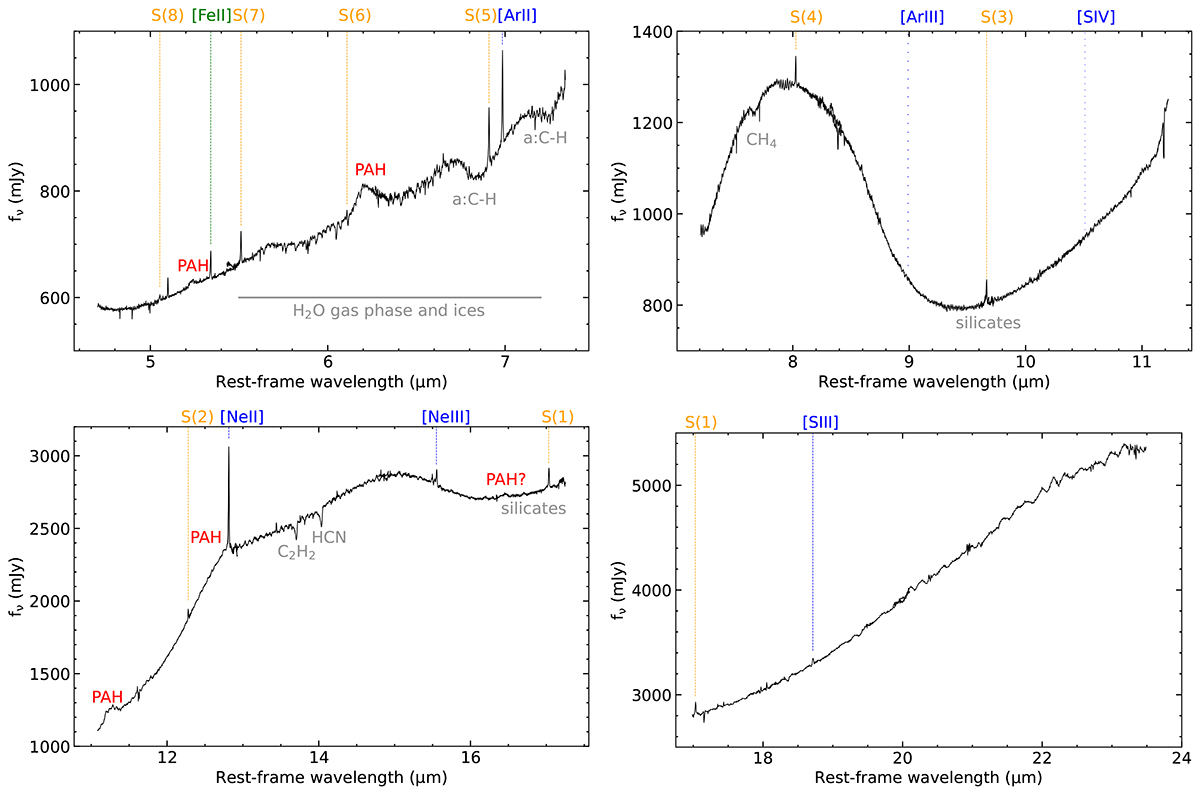
Download original image
Nuclear spectrum shown for each of the MRS channels. As in Fig. 2, the extraction aperture had a 1″-radius. Each panel shows the A, B, and C sub-channels (ch1 upper left, ch2 upper right, ch3 lower left, and ch4 lower right), except for ch4 for which we only show A and B (see text). The dashed lines mark the detected low-excitation fine-structure emission lines (blue and green) and rotational H2 lines (orange). The loosely dotted lines are other relatively low IP lines not detected in the nuclear spectrum (see text for more details). Also labeled are the positions of PAHs, silicate features, and some molecular absorption bands.
Current usage metrics show cumulative count of Article Views (full-text article views including HTML views, PDF and ePub downloads, according to the available data) and Abstracts Views on Vision4Press platform.
Data correspond to usage on the plateform after 2015. The current usage metrics is available 48-96 hours after online publication and is updated daily on week days.
Initial download of the metrics may take a while.