Open Access
Fig. E.1.
Download original image
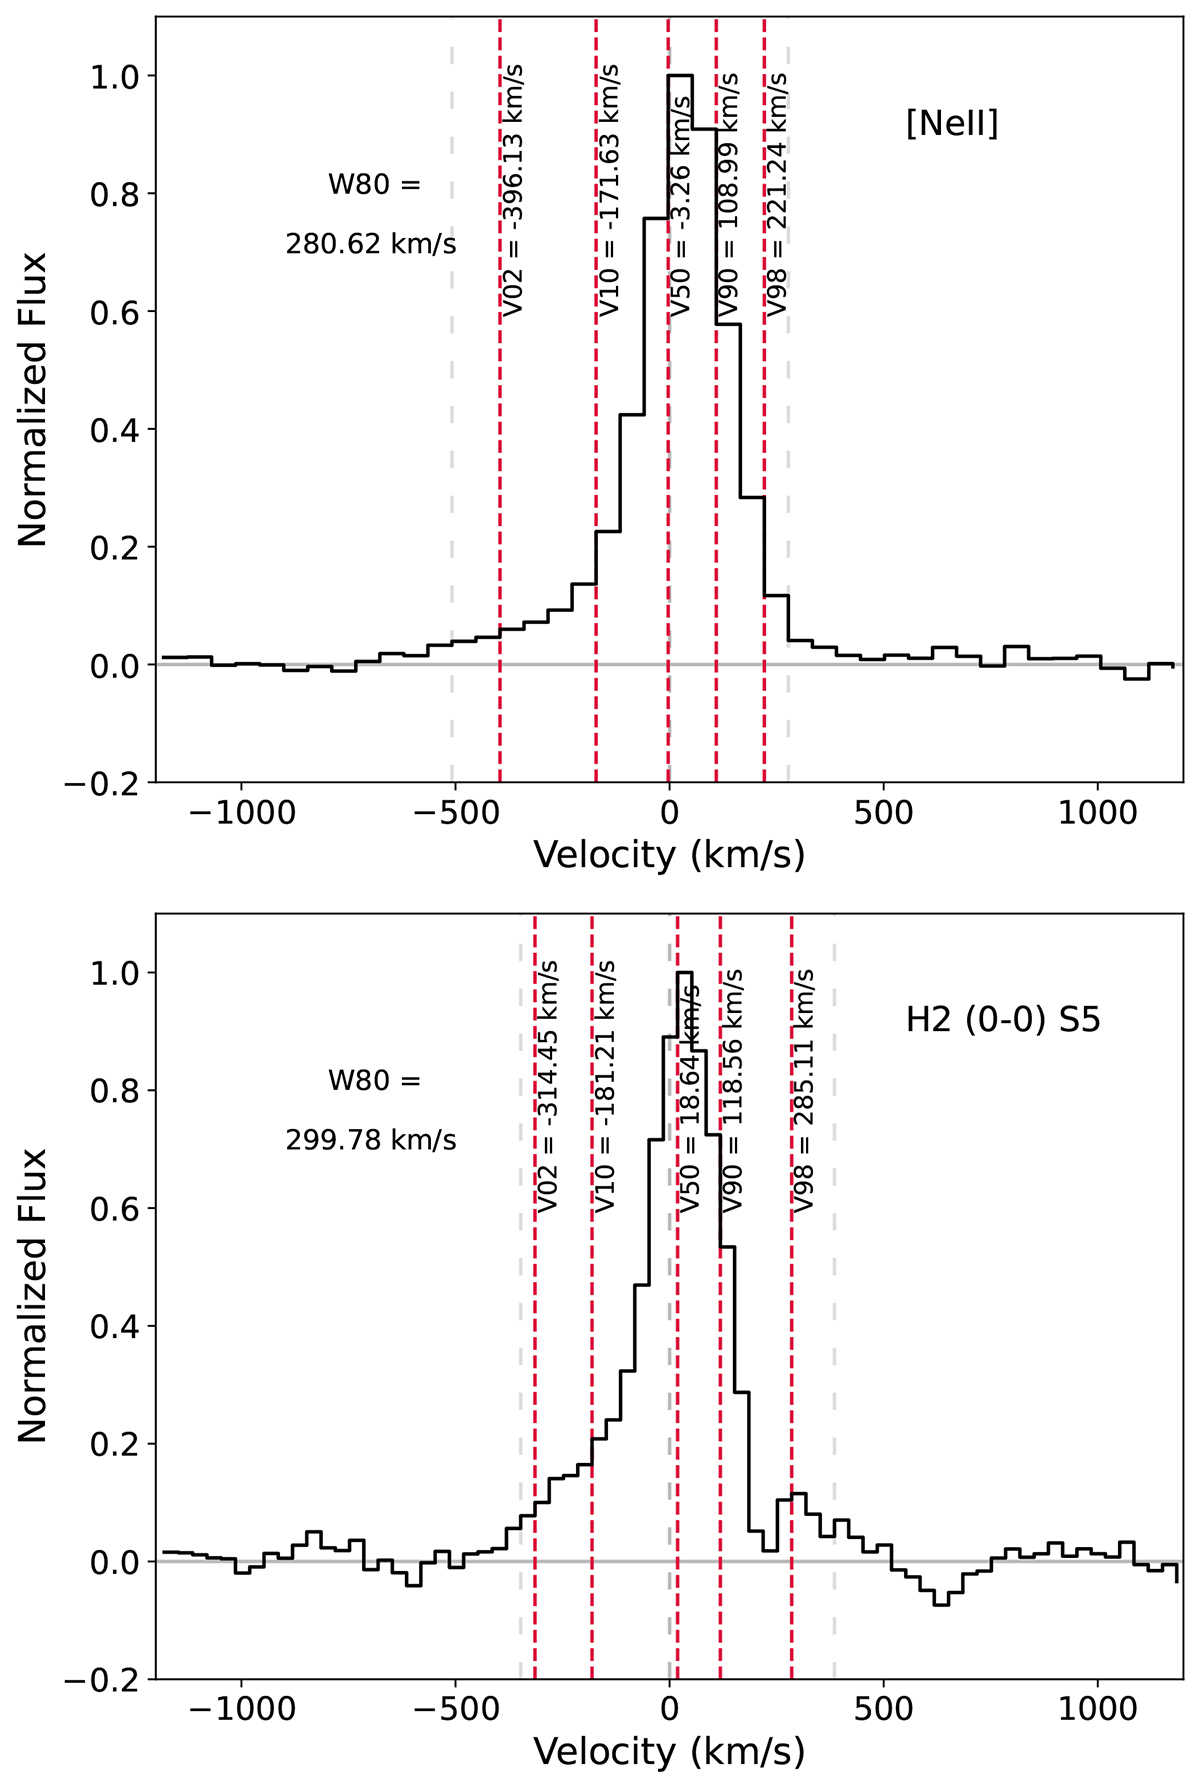
Non-parametric analysis of two nuclear line profiles: [Ne II] (top panel) and H2 S(5) (bottom panel). The derived velocities (see text for details) are marked with red vertical lines. The gray lines indicate the limits of the emission line defined as fluxes above two times the standard deviation of the (zero) continuum.
Current usage metrics show cumulative count of Article Views (full-text article views including HTML views, PDF and ePub downloads, according to the available data) and Abstracts Views on Vision4Press platform.
Data correspond to usage on the plateform after 2015. The current usage metrics is available 48-96 hours after online publication and is updated daily on week days.
Initial download of the metrics may take a while.