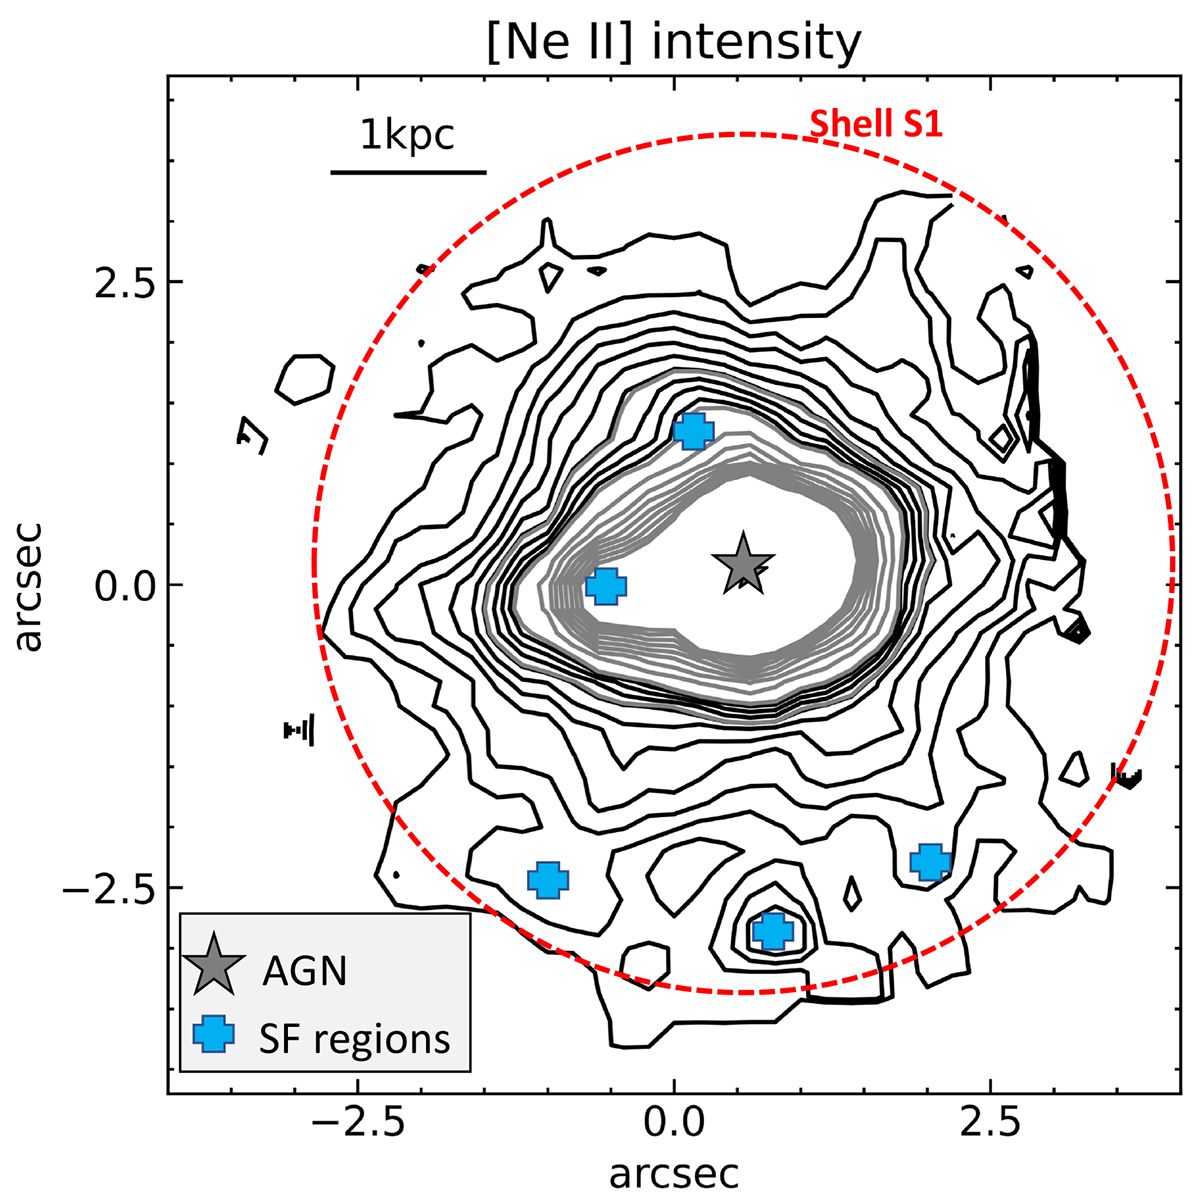
Fig. C.6.
Download original image
Contour map of the MRS [Ne II] emission. We mark some of the SF regions discussed in the text. We generated this [Ne II] map by integrating all the line emission and subtracting a local continuum measured on both sides of the line. The black contours are shown in a square root scale, while the gray ones are in a linear scale.
Current usage metrics show cumulative count of Article Views (full-text article views including HTML views, PDF and ePub downloads, according to the available data) and Abstracts Views on Vision4Press platform.
Data correspond to usage on the plateform after 2015. The current usage metrics is available 48-96 hours after online publication and is updated daily on week days.
Initial download of the metrics may take a while.