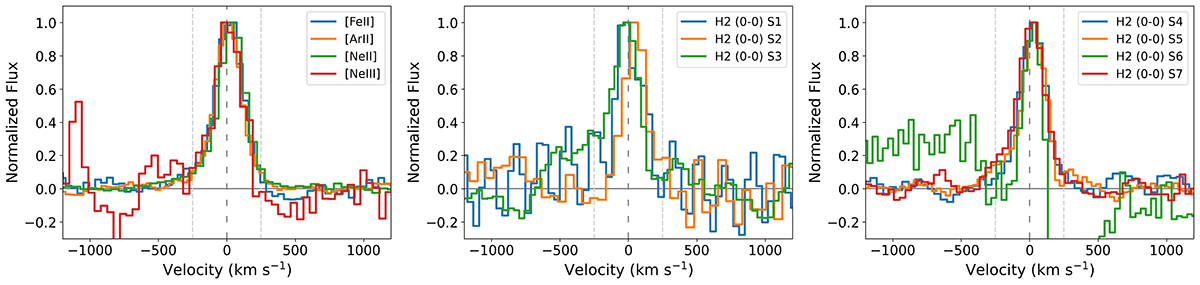
Fig. 12.
Download original image
Line profiles from the nuclear region (r = 1″ aperture). Left panel: fine-structure lines, and middle and right panels: H2 S(7) to S(4) and S(3) to S(1) transitions, respectively. The 0 km s−1 value corresponds to the adopted z = 0.004217. Note that the red part of the H2 S(6) line profile (green line, middle panel) is inside one of the H2O molecular absorptions. We did not apply the 1D residual fringe correction.
Current usage metrics show cumulative count of Article Views (full-text article views including HTML views, PDF and ePub downloads, according to the available data) and Abstracts Views on Vision4Press platform.
Data correspond to usage on the plateform after 2015. The current usage metrics is available 48-96 hours after online publication and is updated daily on week days.
Initial download of the metrics may take a while.