Fig. 11.
Download original image
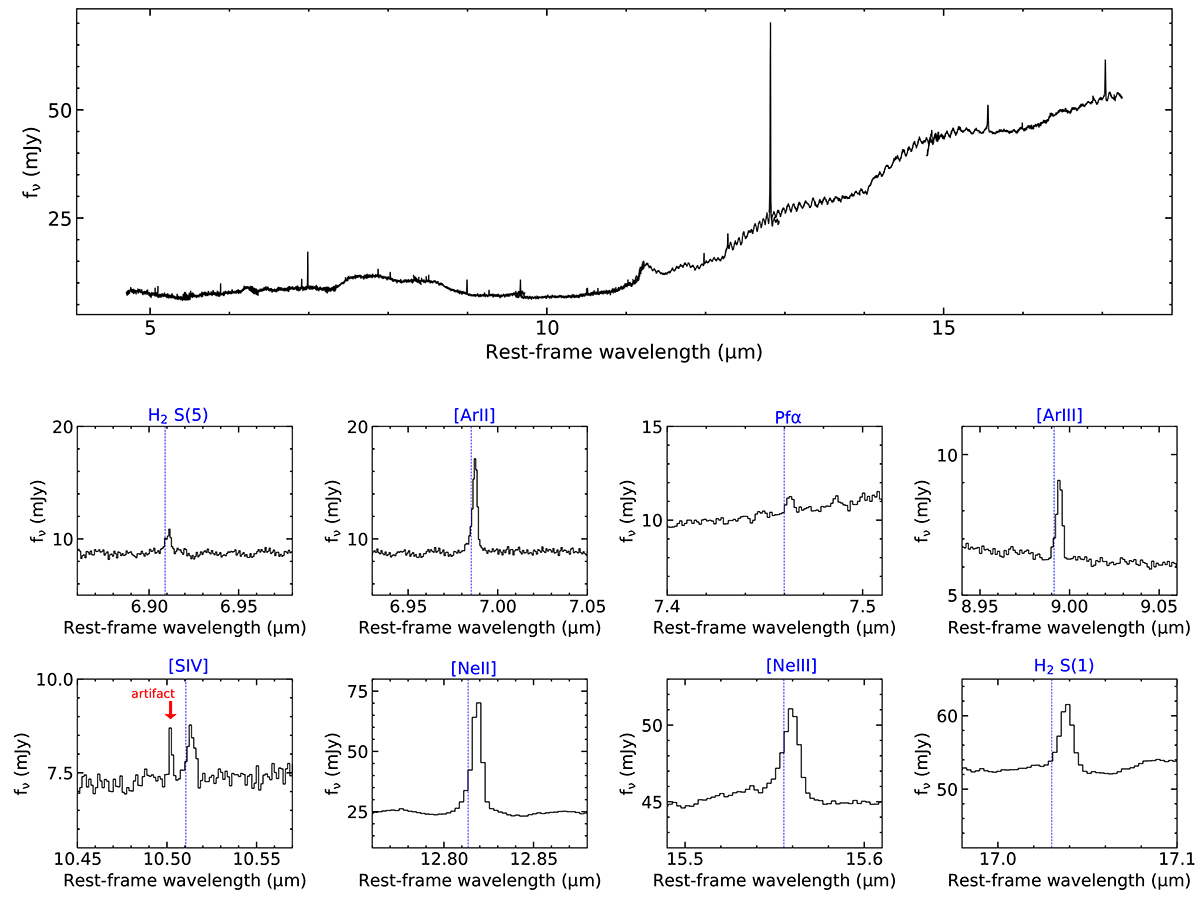
MRS spectra of the star-forming region 1.1″ SE of the AGN. Top panel: ch1 to ch3 spectra extracted with a 0.3″ radius. We applied the residual fringing correction to the 1D spectra and scaling factors to stitch together the spectra of the different sub-channels. Middle and bottom panels: zoomed-in spectral regions of selected emission lines. In all panels, the rest-frame wavelengths were computed with the redshift quoted in Sect. 1 and appear redshifted with respect to the systemic velocity (see mean-velocity maps of [Ar II] and [Ne II], middle panels of Figs. 5 and 6), due to rotation.
Current usage metrics show cumulative count of Article Views (full-text article views including HTML views, PDF and ePub downloads, according to the available data) and Abstracts Views on Vision4Press platform.
Data correspond to usage on the plateform after 2015. The current usage metrics is available 48-96 hours after online publication and is updated daily on week days.
Initial download of the metrics may take a while.