Fig. 15
Download original image
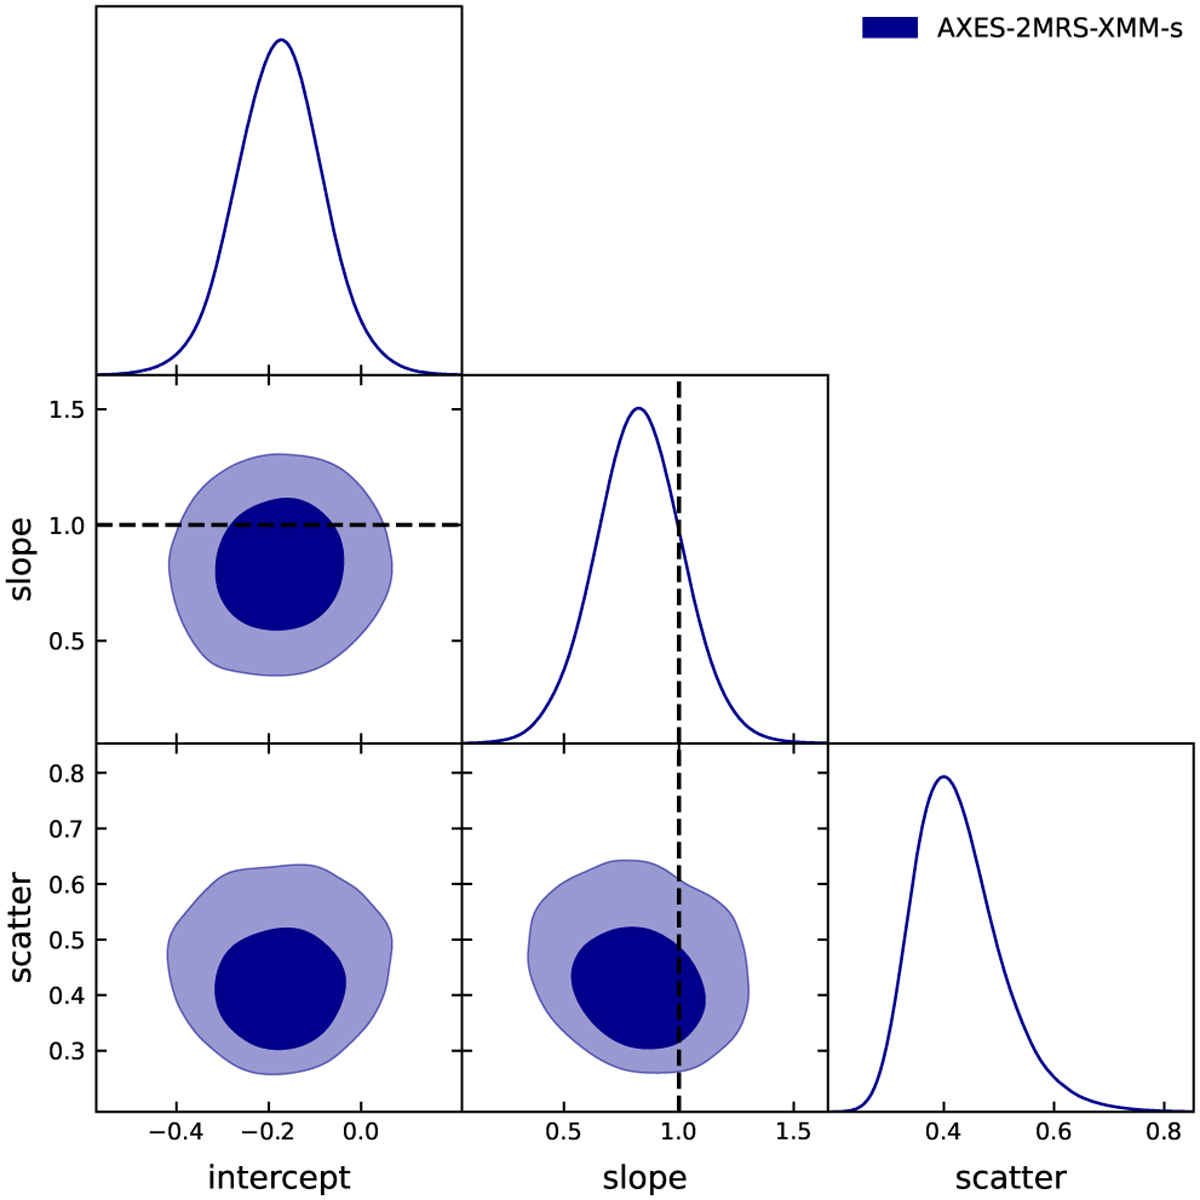
MCMC fitting results with one- and two-dimensional projections of the posteriors of the XMM-LX–RASS Lx scaling relation for the AXES-2MRS-XMM sample. The vertical and horizontal lines represent the one-to-one relation and correspond to the red line in Fig. 14. Dark and light contours represent 68% and 95% confidence levels, respectively.
Current usage metrics show cumulative count of Article Views (full-text article views including HTML views, PDF and ePub downloads, according to the available data) and Abstracts Views on Vision4Press platform.
Data correspond to usage on the plateform after 2015. The current usage metrics is available 48-96 hours after online publication and is updated daily on week days.
Initial download of the metrics may take a while.