Open Access
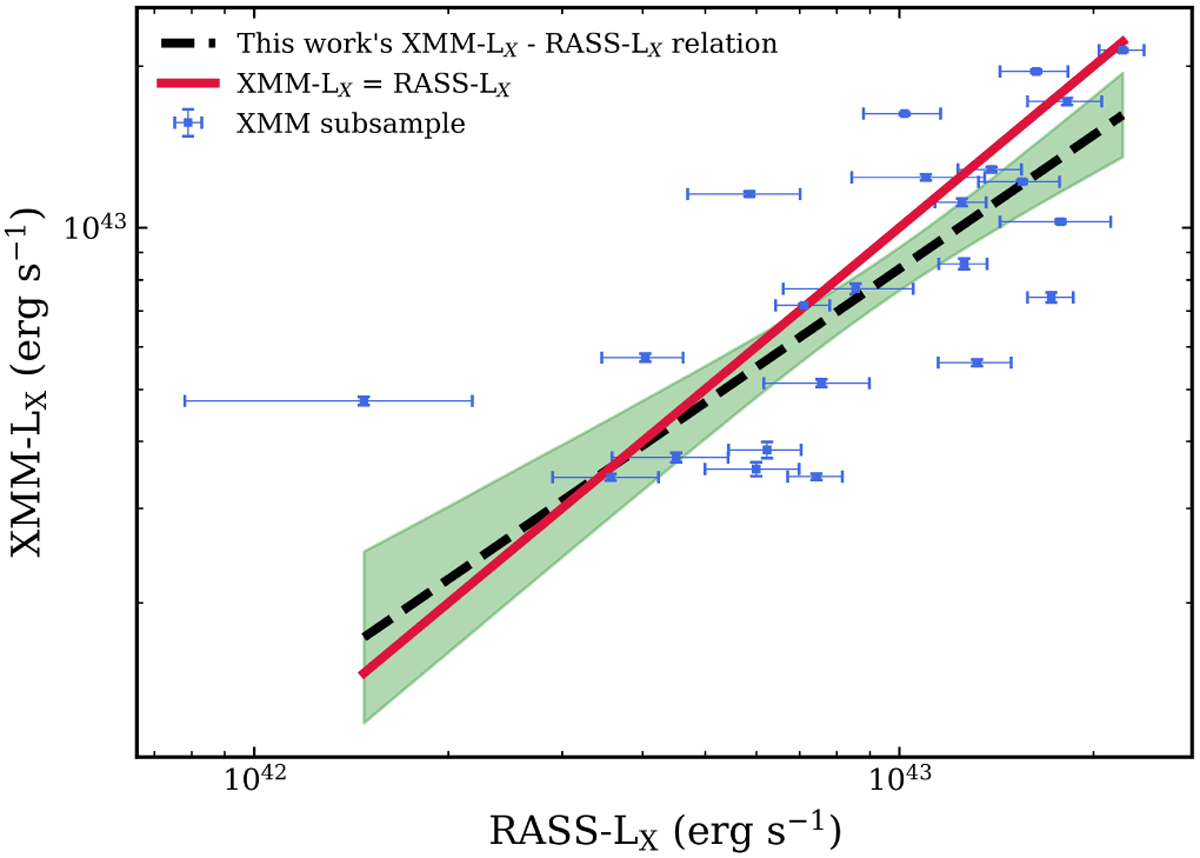
Fig. 14
Download original image
Comparison of AXES-2MRS X-ray luminosity measurements between XMM-Newton and RASS. The dashed line is the best fit. The solid line gives the one-to-one relation between XMM-Newton and RASS. The shaded region is the 1σ uncertainty of the slope and intercept.
Current usage metrics show cumulative count of Article Views (full-text article views including HTML views, PDF and ePub downloads, according to the available data) and Abstracts Views on Vision4Press platform.
Data correspond to usage on the plateform after 2015. The current usage metrics is available 48-96 hours after online publication and is updated daily on week days.
Initial download of the metrics may take a while.