Fig. 13
Download original image
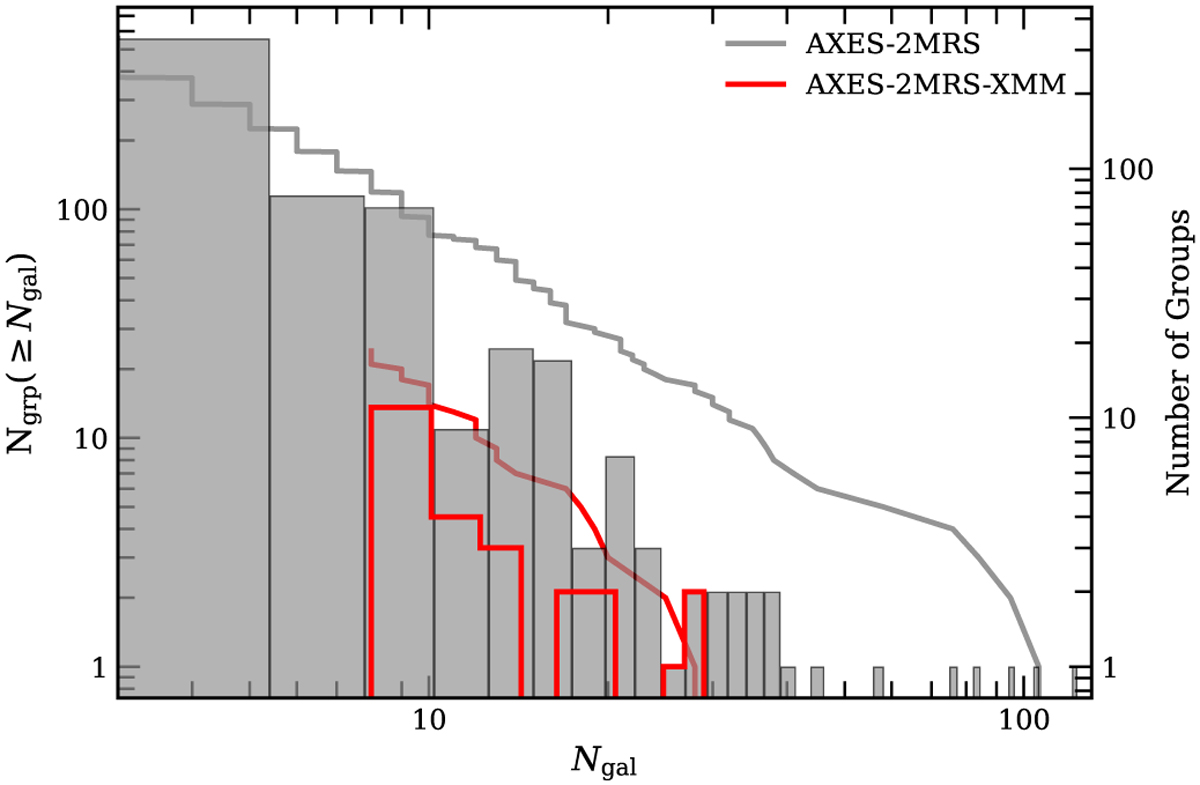
Cumulative distributions (curves) and frequency distributions (histograms) of the number of member galaxies (which also traces the group richnesses) for the full AXES-2MRS groups (grey) and the XMM-Newton subsample (red). The left Y-axis shows the values of the cumulative distribution curves, while the right Y-axis shows the values of the frequency distribution curves.
Current usage metrics show cumulative count of Article Views (full-text article views including HTML views, PDF and ePub downloads, according to the available data) and Abstracts Views on Vision4Press platform.
Data correspond to usage on the plateform after 2015. The current usage metrics is available 48-96 hours after online publication and is updated daily on week days.
Initial download of the metrics may take a while.