Fig. 3.
Download original image
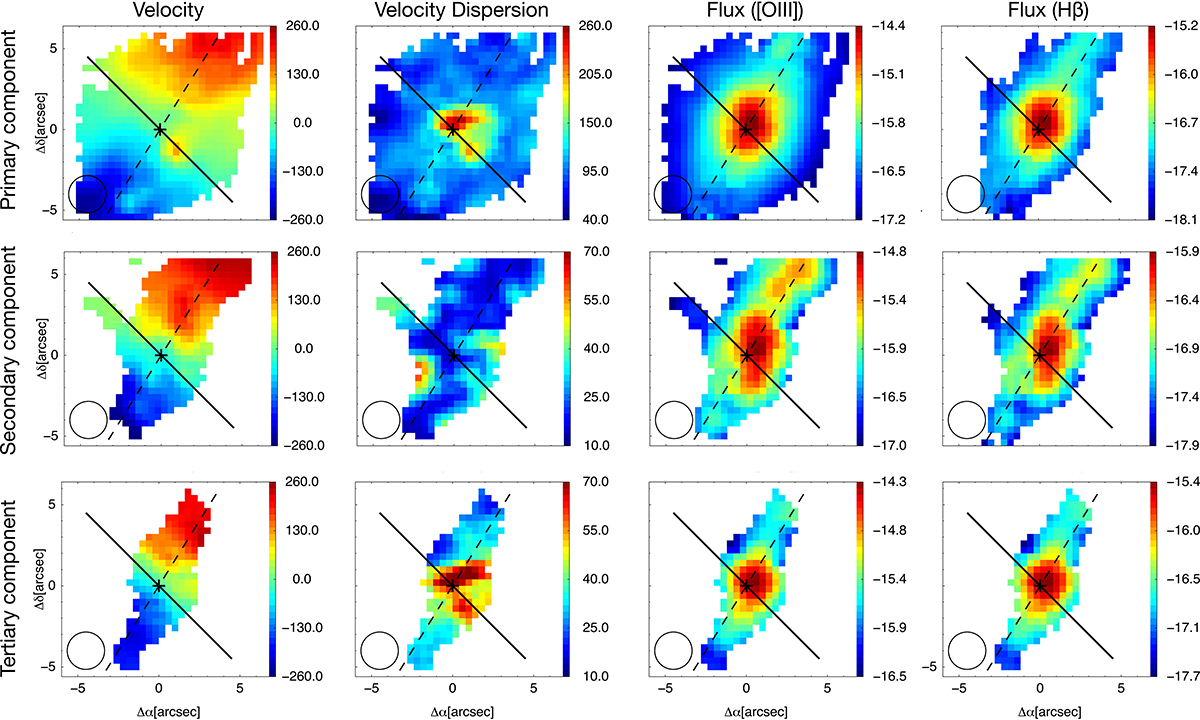
[O III]λ5007 velocity field (km s−1) and velocity dispersion (km s−1) maps and flux intensity maps (erg s−1 cm−2) for the [O III]λ5007 and Hβ emission lines for the primary component, the broadest of the detected components (Sect. 3). The cross marks the position of the photometric centre. The solid black line indicates the orientation of the radio jet (PAjet = 45°; Table 1). The dashed lines indicate the PA we used to extract the diagrams shown in Fig. 5. The maps are spatially smoothed (boxcar average) with a smoothing window of two spaxels (i.e. 0![]() 8). The size of the MEGARA PSF is indicated with a circle (as in Fig. 1 and in all the maps presented in this paper).
8). The size of the MEGARA PSF is indicated with a circle (as in Fig. 1 and in all the maps presented in this paper).
Current usage metrics show cumulative count of Article Views (full-text article views including HTML views, PDF and ePub downloads, according to the available data) and Abstracts Views on Vision4Press platform.
Data correspond to usage on the plateform after 2015. The current usage metrics is available 48-96 hours after online publication and is updated daily on week days.
Initial download of the metrics may take a while.