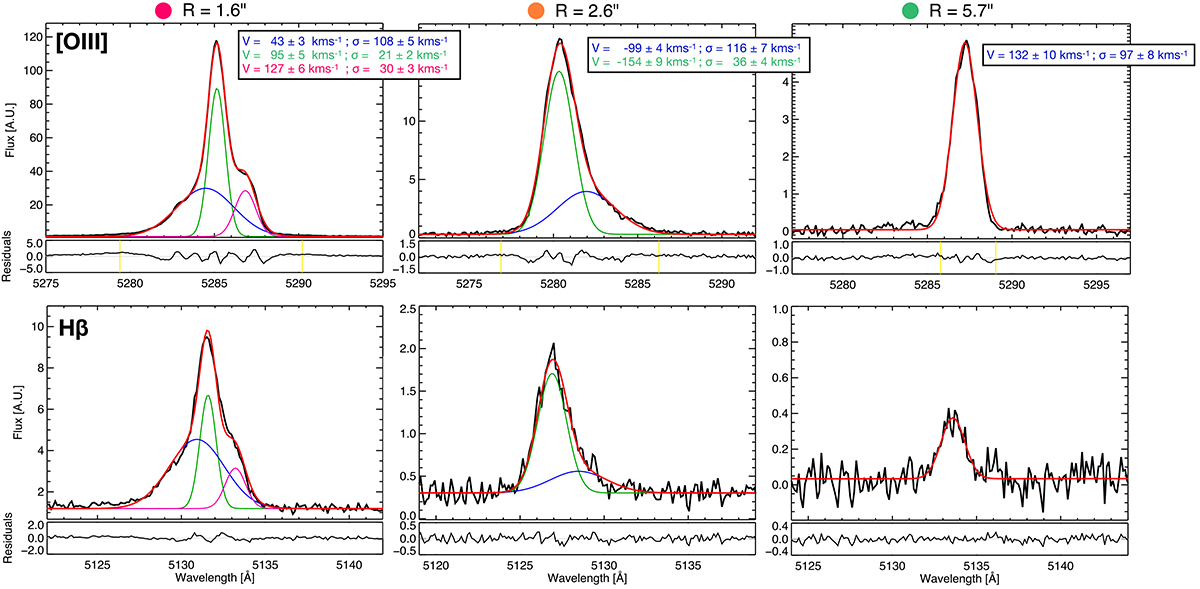
Fig. 2.
Download original image
Examples of emission line spectra (black) and their modelling at different galactocentric distances (R; see the top labels and symbols in Fig. 1). Both [O III]λ5007 (top) and Hβ features are displayed at the corresponding observed wavelengths (i.e. no correction for redshift; see Sect. 3). For each panel, we show the modelled line profile (red line) and the components (with different colours). Specifically, Gaussian curves indicate the primary (green), secondary (blue), and tertiary (pink) components we used to model the profiles. Residuals from the fit are shown in the small lower panels, in which vertical yellow lines mark the wavelength range we considered to calculate the εline (for the [O III]λ5007 line only; e.g. Sect. 3 for details). The insets in the upper panels indicate the kinematic values of the components (the emission lines were tied to share the same kinematics).
Current usage metrics show cumulative count of Article Views (full-text article views including HTML views, PDF and ePub downloads, according to the available data) and Abstracts Views on Vision4Press platform.
Data correspond to usage on the plateform after 2015. The current usage metrics is available 48-96 hours after online publication and is updated daily on week days.
Initial download of the metrics may take a while.