Fig. 1.
Download original image
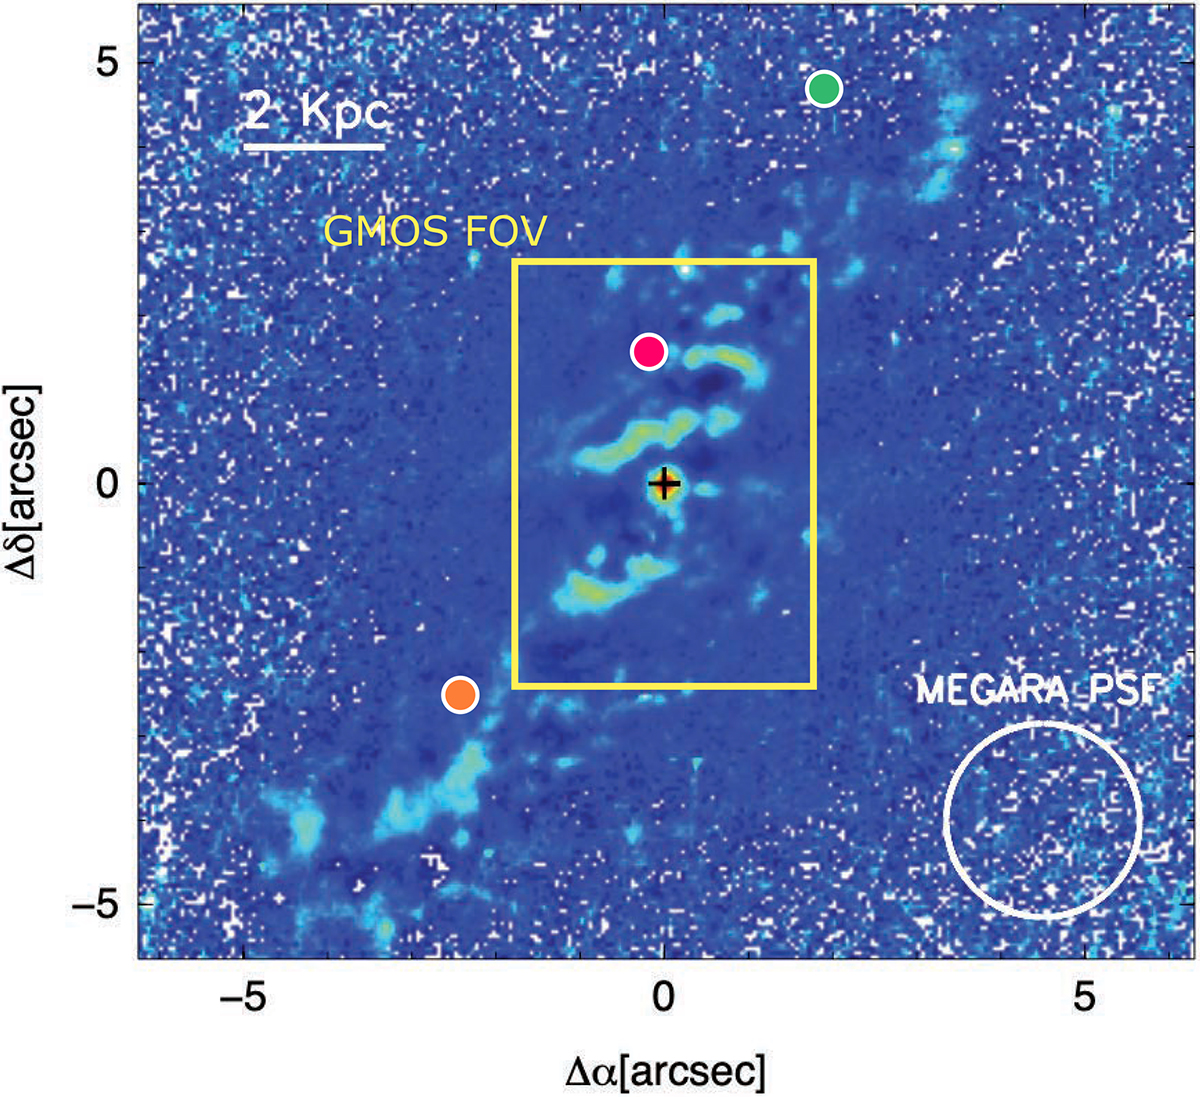
HST sharp-divided image obtained from the data of the Advanced Camera for Surveys using the FR551N filter. It was obtained following the receipt in Márquez et al. (2003), i.e. by dividing the original image, I, by a filtered version of it. The image is displayed with a zoomed-in view that matches the FoV of our MEGARA observations (Sect. 2). The cross is the photometric centre. The size of the MEGARA PSF is indicated in the bottom right part of the figure. The white bar in the upper left corner represents 2 kpc (1![]() 7). The green, pink, and orange circles mark the spatial location at which we extracted the line profiles (and the corresponding modelling) shown in Fig. 2. The yellow box marks the GEMINI/GMOS field of view from previous IFS observations (Keel et al. 2017).
7). The green, pink, and orange circles mark the spatial location at which we extracted the line profiles (and the corresponding modelling) shown in Fig. 2. The yellow box marks the GEMINI/GMOS field of view from previous IFS observations (Keel et al. 2017).
Current usage metrics show cumulative count of Article Views (full-text article views including HTML views, PDF and ePub downloads, according to the available data) and Abstracts Views on Vision4Press platform.
Data correspond to usage on the plateform after 2015. The current usage metrics is available 48-96 hours after online publication and is updated daily on week days.
Initial download of the metrics may take a while.