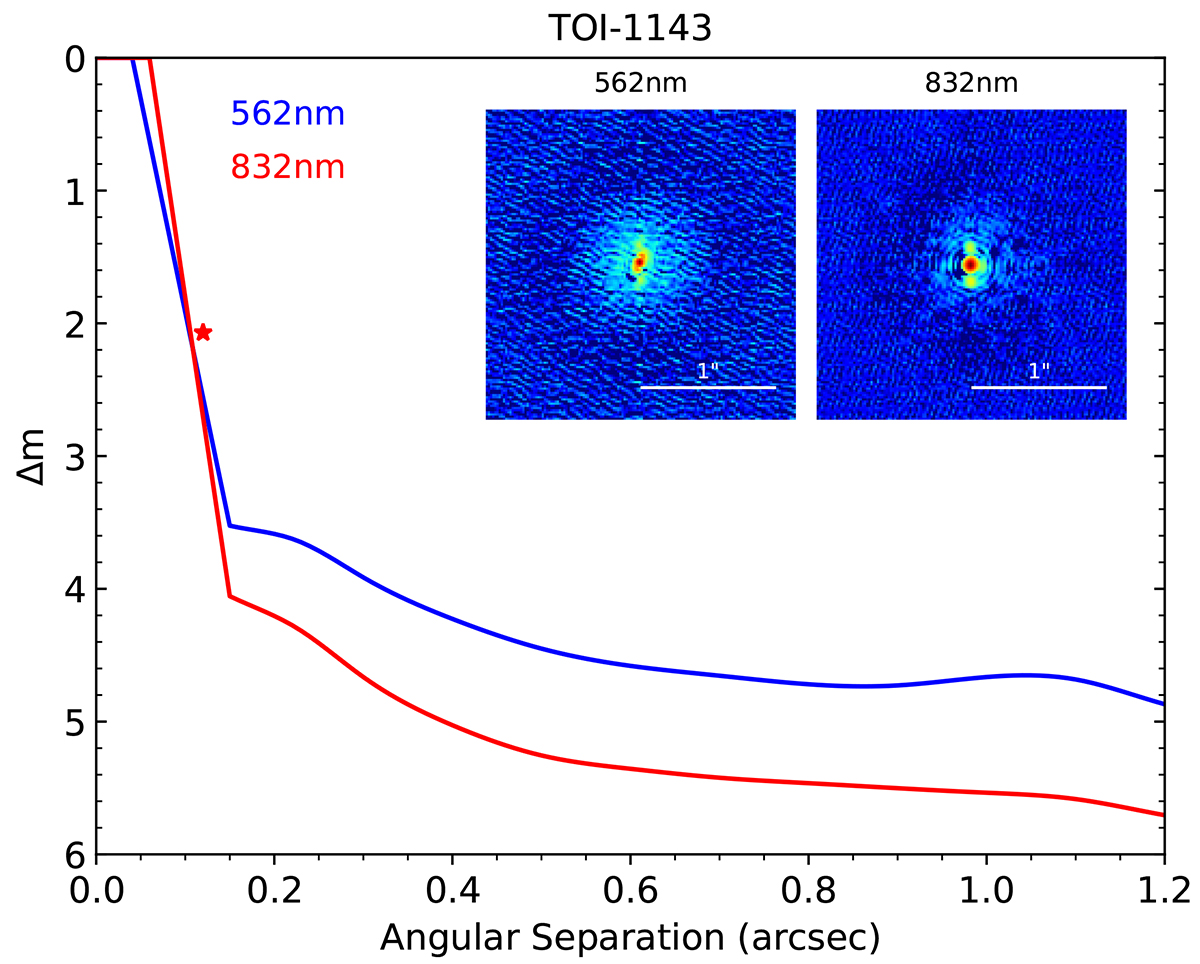
Fig. 4.
Download original image
Contrast curves for TOI-1143 showing the detection limit of NESSI speckle imaging in the 562 nm (blue curve) and 832 nm filters (red curve). The star symbol indicates the separation and contrast of the detected companion. A reconstructed image for each filter is shown in the upper right, with TOI-1143 in the center of the field. The companion appears as a pair of close-by sources lying roughly north and south of TOI-1143. The double image is due to an ambiguity in the image reconstruction. These images are oriented with north at the top and east to the left.
Current usage metrics show cumulative count of Article Views (full-text article views including HTML views, PDF and ePub downloads, according to the available data) and Abstracts Views on Vision4Press platform.
Data correspond to usage on the plateform after 2015. The current usage metrics is available 48-96 hours after online publication and is updated daily on week days.
Initial download of the metrics may take a while.