Open Access
Fig. 12.
Download original image
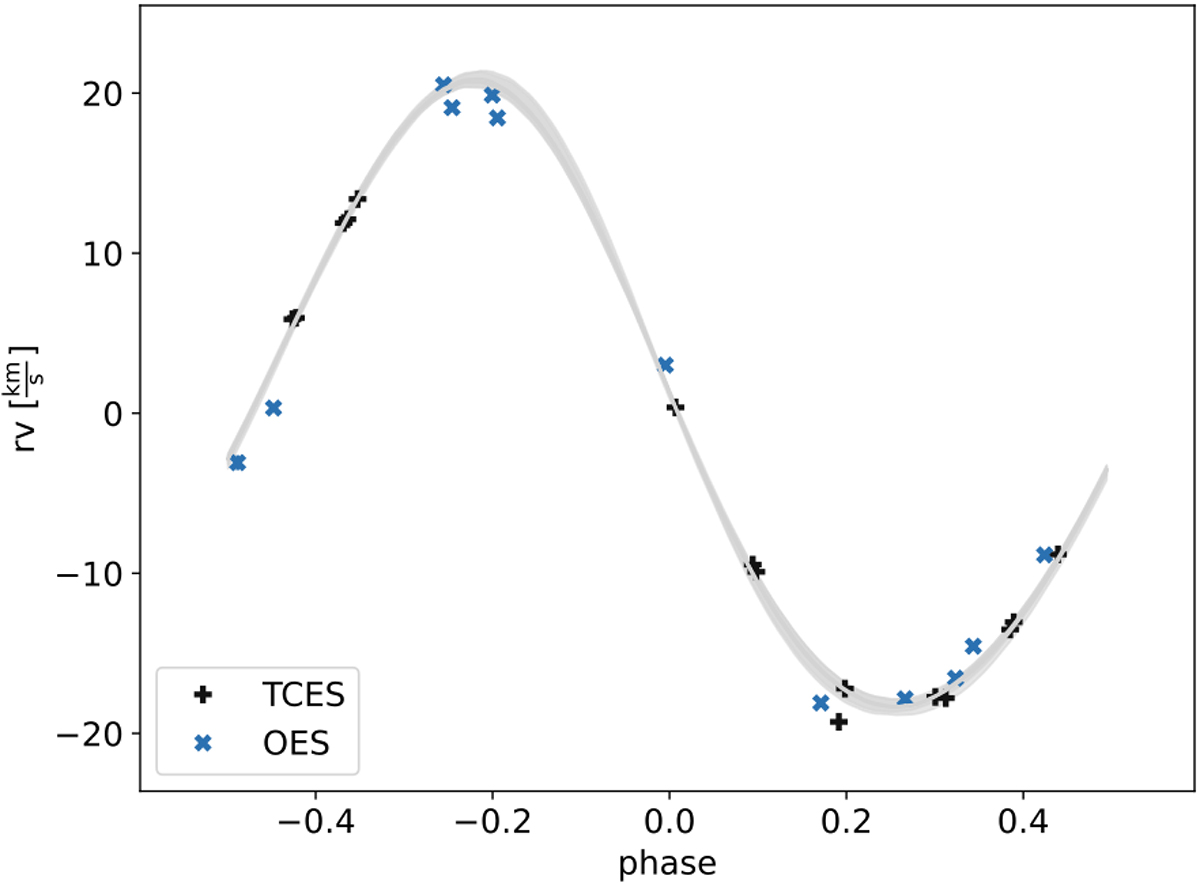
Radial-velocity curve of TOI-1788 obtained by OES and TCES after correction for instrumental zero-point shift. The shaded region demonstrates uncertainty in model posteriors, and errors of measured data points are smaller than the symbols. The higher than expected scatter is caused by stellar spots on the primary.
Current usage metrics show cumulative count of Article Views (full-text article views including HTML views, PDF and ePub downloads, according to the available data) and Abstracts Views on Vision4Press platform.
Data correspond to usage on the plateform after 2015. The current usage metrics is available 48-96 hours after online publication and is updated daily on week days.
Initial download of the metrics may take a while.