Fig. 7
Download original image
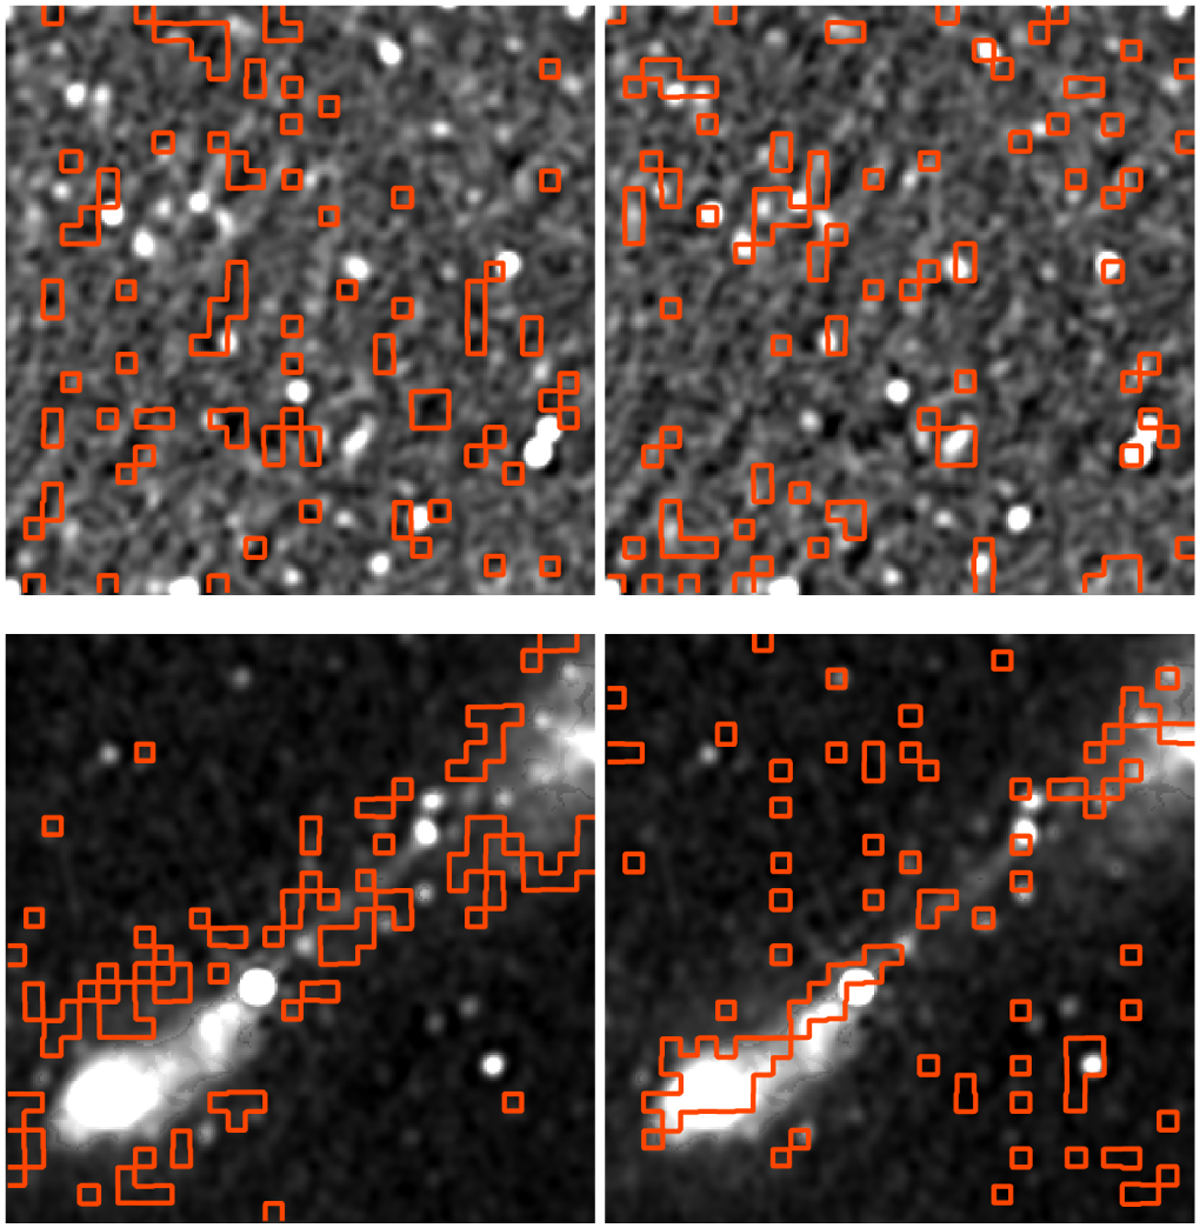
Attention maps overlaid on the crop of Abell 209 from Figure 2 (top) and an extended source from the same field (bottom). The left and right panels show maps from two of ViT-small’s six attention heads. As the network architecture has a patch size of eight, the 90th percentile of the attention maps shows the 8×8 patches that the specific attention head considers most important in the image.
Current usage metrics show cumulative count of Article Views (full-text article views including HTML views, PDF and ePub downloads, according to the available data) and Abstracts Views on Vision4Press platform.
Data correspond to usage on the plateform after 2015. The current usage metrics is available 48-96 hours after online publication and is updated daily on week days.
Initial download of the metrics may take a while.