Open Access
Fig. 6
Download original image
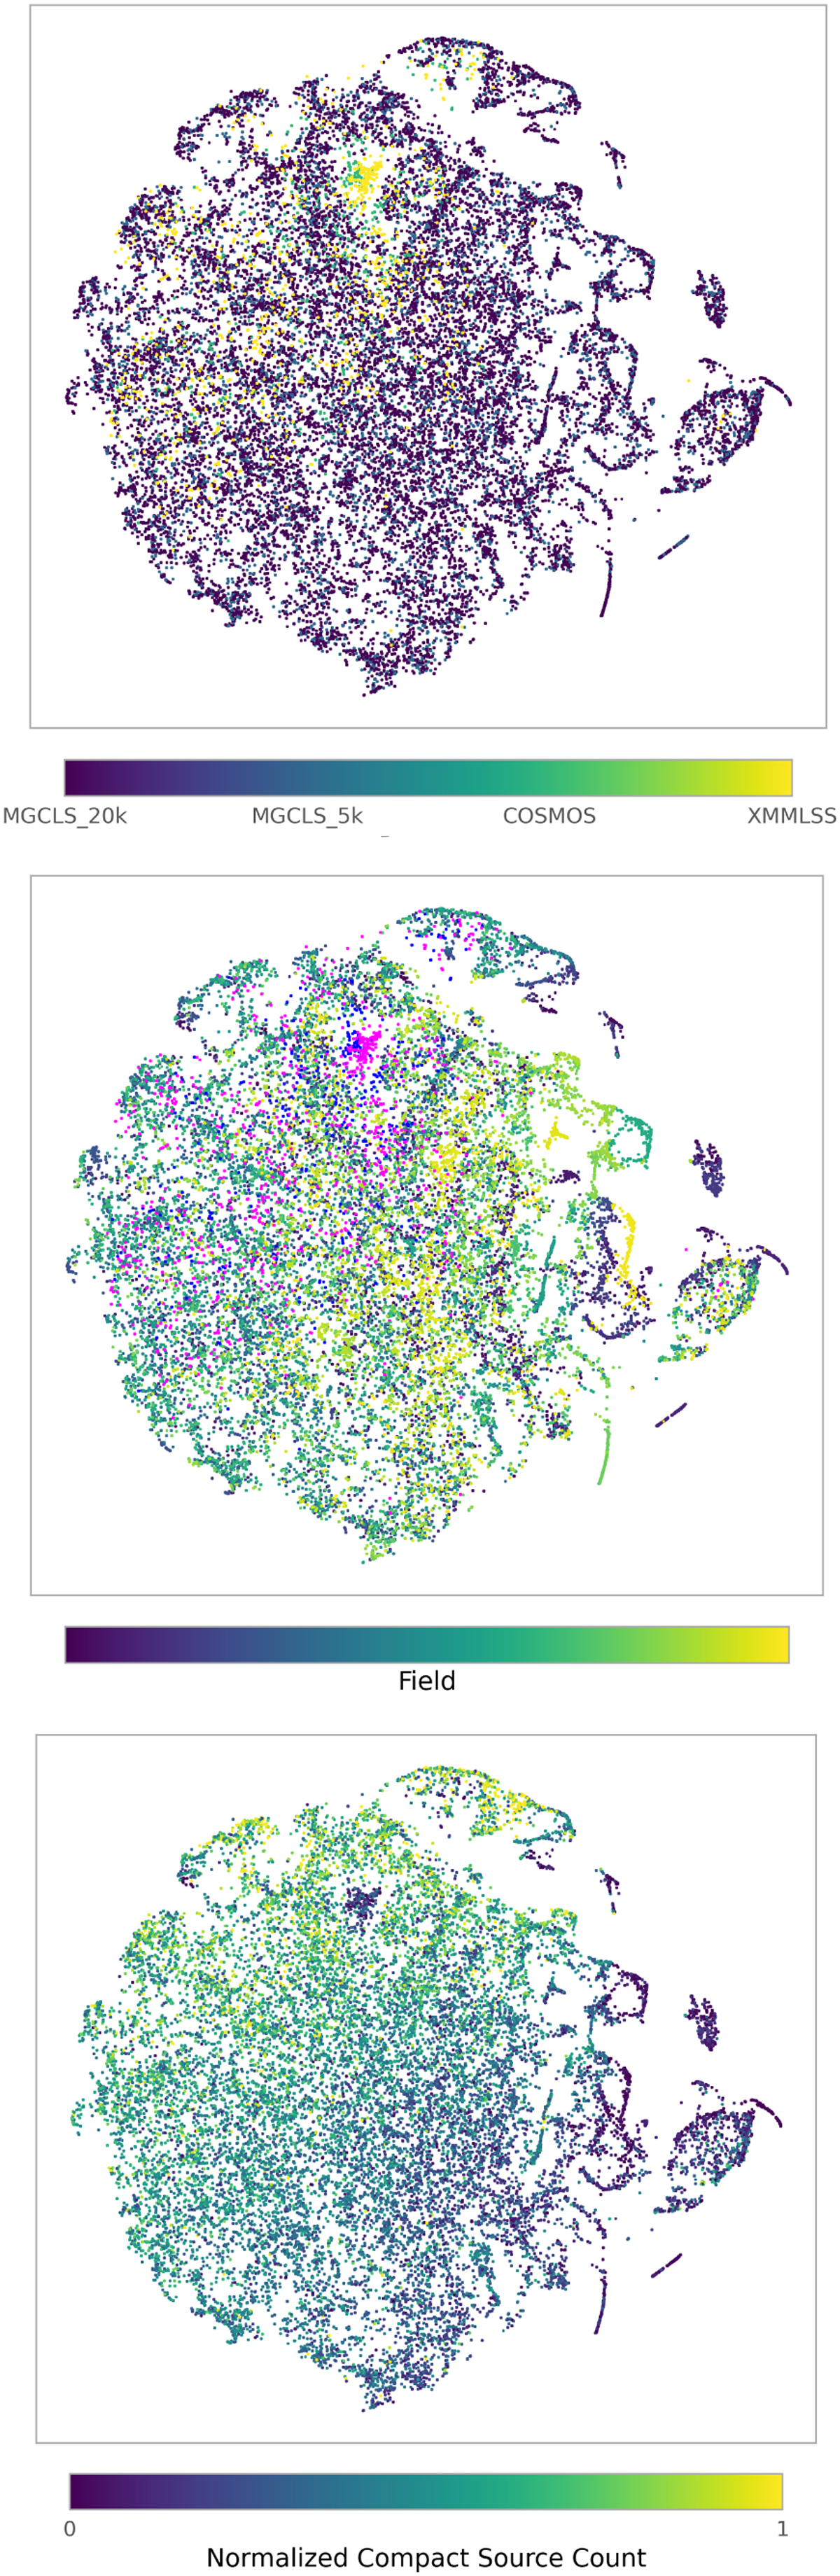
Features extracted from our trained Resnet backbone, visualized via t-SNE in two dimensions. The top panel shows patterns by dataset; the middle by observation field, with COSMOS and XMMLSS in blue and magenta, respectively; and finally by the number of compact sources per crop.
Current usage metrics show cumulative count of Article Views (full-text article views including HTML views, PDF and ePub downloads, according to the available data) and Abstracts Views on Vision4Press platform.
Data correspond to usage on the plateform after 2015. The current usage metrics is available 48-96 hours after online publication and is updated daily on week days.
Initial download of the metrics may take a while.