Fig. A.1
Download original image
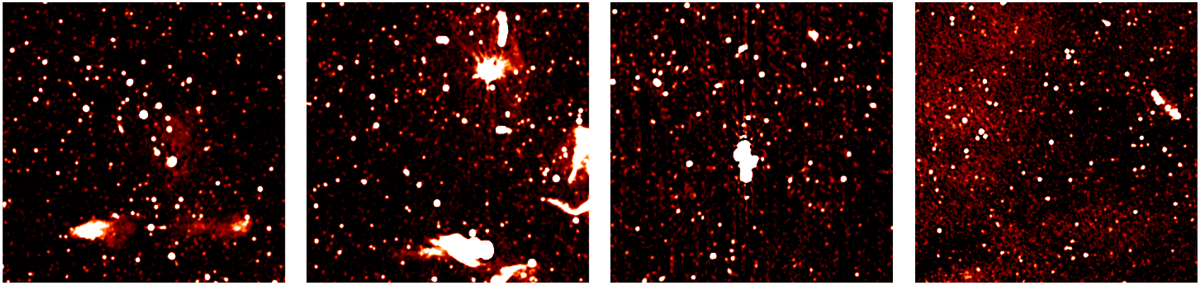
600×600 pixel crops from various MGCLS fields illustrating the Data Quality Flags (DQF). From left to right, they are: 0 = good dynamic range; 1 = moderate dynamic range with some artefacts around bright sources; 2 = poor dynamic range with high contamination by bright source artefacts; 3 = poor dynamic range with ripples across image.
Current usage metrics show cumulative count of Article Views (full-text article views including HTML views, PDF and ePub downloads, according to the available data) and Abstracts Views on Vision4Press platform.
Data correspond to usage on the plateform after 2015. The current usage metrics is available 48-96 hours after online publication and is updated daily on week days.
Initial download of the metrics may take a while.