Fig. 9
Download original image
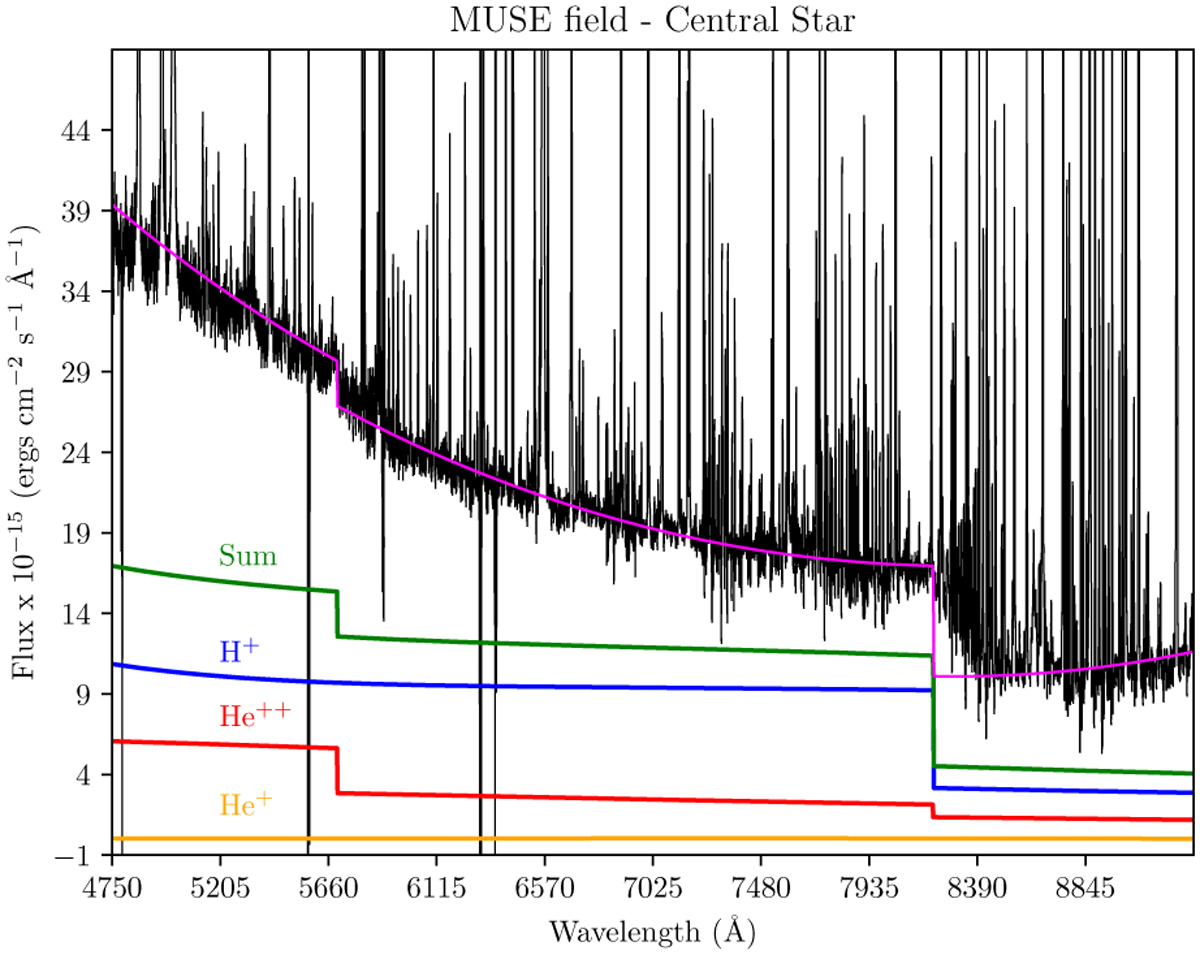
Dereddened spectrum of the full MUSE field of NGC 4361, with the area of the central star subtracted, is shown with the fit of the H+, He+ and He++ nebular continua (in blue, yellow and red, respectively). The sum of the three sets of continua is shown in green. The fit to the spectrum is shown in magenta and includes a scattered light contribution modelled as a third-order polynomial continuum to match the sum of the nebular continua to the measured nebular spectrum. See text for further details and Table 5 (Columns 5 and 6) for the fitted jump temperatures (H I Paschen jump and He II n=5 jump).
Current usage metrics show cumulative count of Article Views (full-text article views including HTML views, PDF and ePub downloads, according to the available data) and Abstracts Views on Vision4Press platform.
Data correspond to usage on the plateform after 2015. The current usage metrics is available 48-96 hours after online publication and is updated daily on week days.
Initial download of the metrics may take a while.