Fig. 3
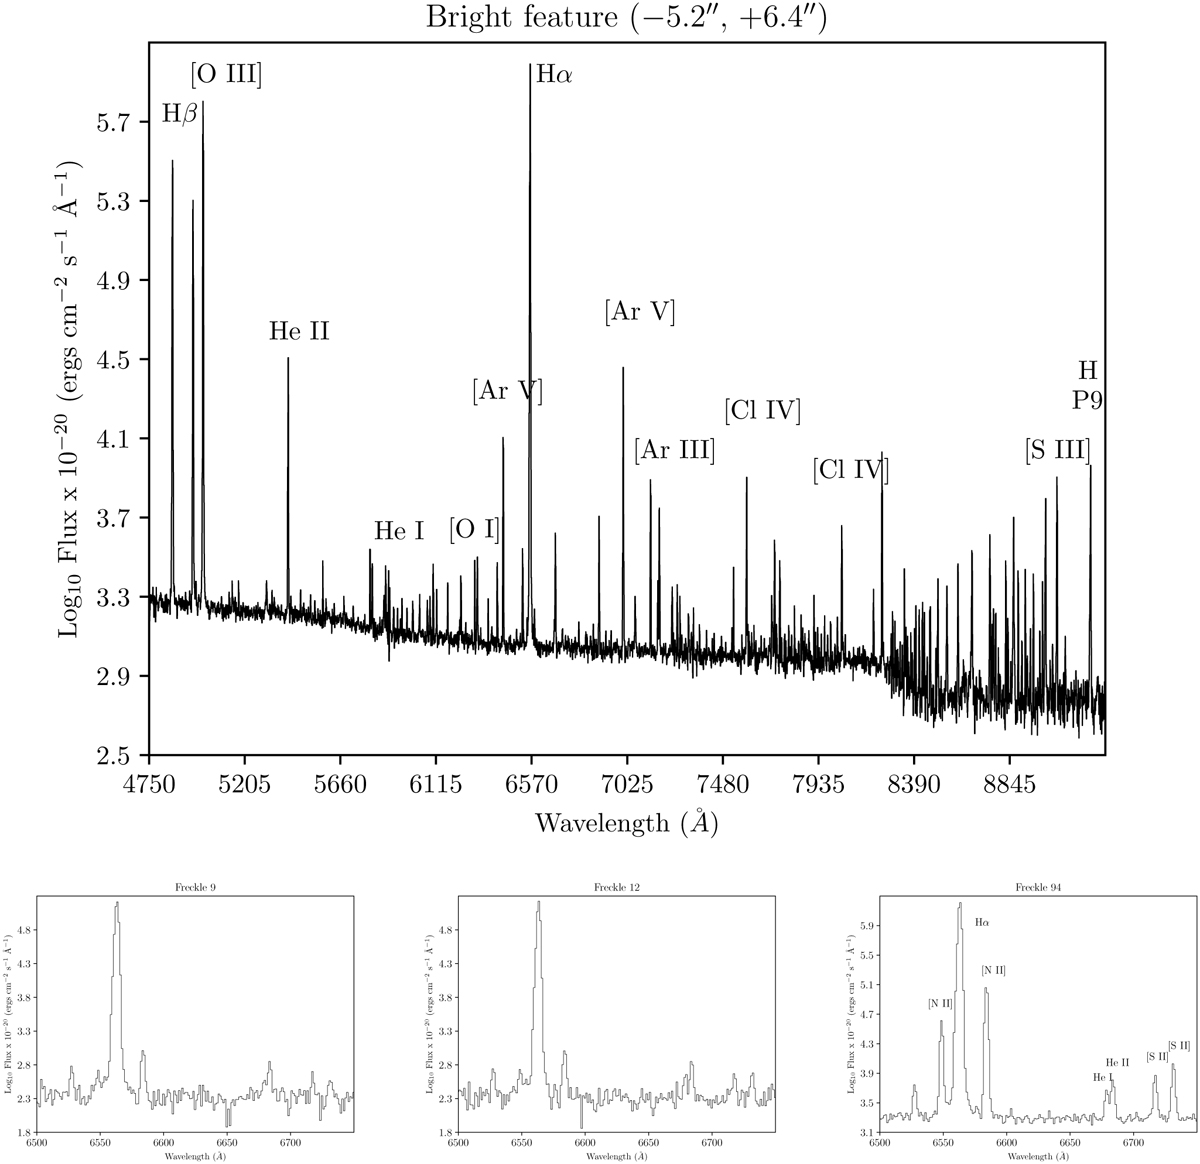
Download original image
Selection of representative spectra (log10 flux) of a few given regions. Top: full observed spectrum over a bright region in the core of the nebula (area 1 arcsec2 − 25 MUSE spaxels) centred at (Δα − 5.2″, Δδ + 6.4″) relative to the position of the CS. Bottom: three example spectra over freckles chosen to sample faint, average, and bright freckles (based on their extracted Hα and [N II] fluxes; see Sect. 5.2). Left: spectrum of a faint freckle (9). Centre: Spectrum of a freckle (12) whose Hα and N II fluxes mark it as of average brightness; spectrum of the brightest freckle (94). Note: these spectra of freckles include the (high-ionisation) background nebular spectrum within the area of the freckle.
Current usage metrics show cumulative count of Article Views (full-text article views including HTML views, PDF and ePub downloads, according to the available data) and Abstracts Views on Vision4Press platform.
Data correspond to usage on the plateform after 2015. The current usage metrics is available 48-96 hours after online publication and is updated daily on week days.
Initial download of the metrics may take a while.