Fig. 11
Download original image
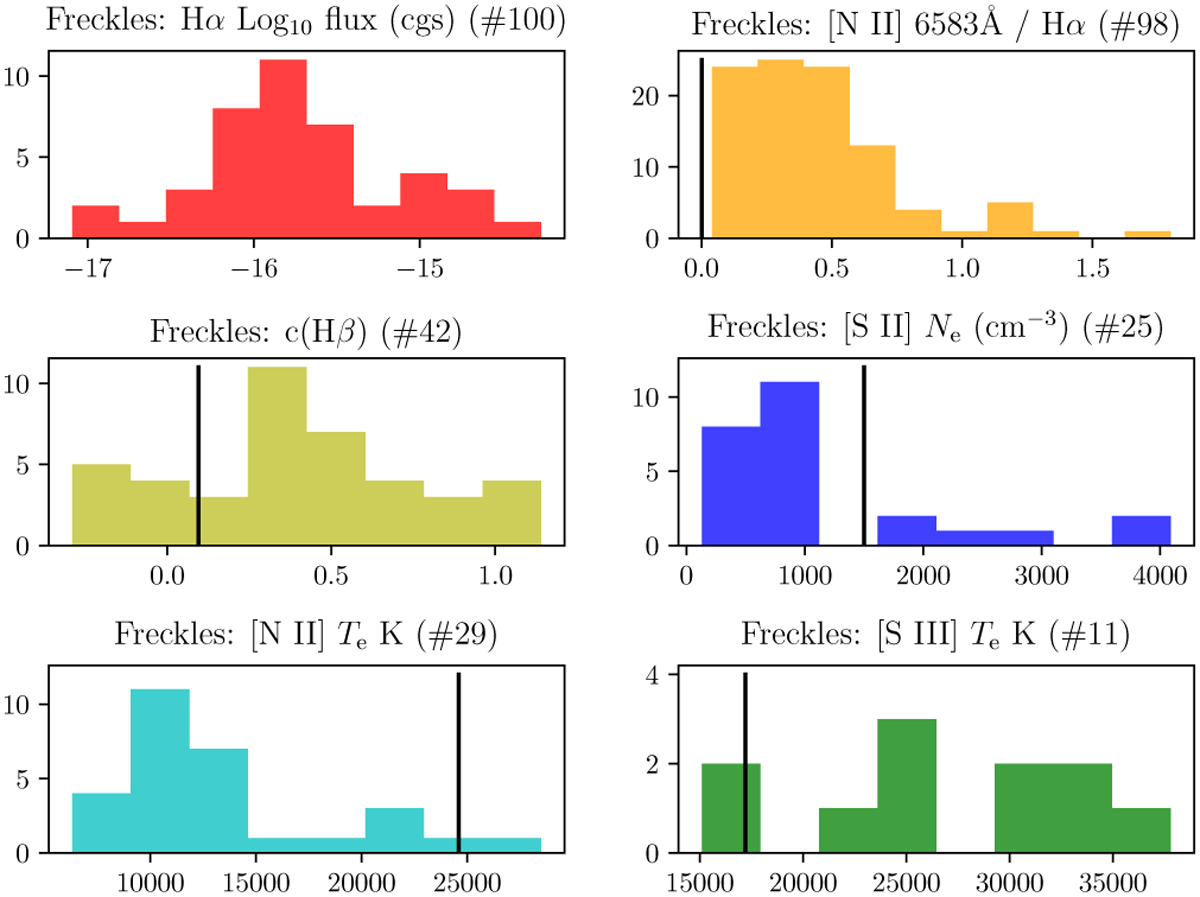
Histograms of the properties of the freckles: the observed Hα flux (log erg cm−2 s−1) (top left); the [N II]6583 Å/Hα ratio (upper right); log extinction at Hβ, c from Hα/Hβ (centre left); Ne ([S II]) (cm−3 (centre right); Te ([N II]) K (bottom left); Te ([S III]) K (bottom right); The vertical bar in the plots shows the corresponding value for the large- scale nebular emission of NGC 4361 from the MUSE central field, but excluding the area of the freckles. Note: each histogram only plots the available number of values of each parameter (listed in the title to each plot as (#) ); for the extinction, Ne and Te histograms only the values from the A and B quality spectra are shown.
Current usage metrics show cumulative count of Article Views (full-text article views including HTML views, PDF and ePub downloads, according to the available data) and Abstracts Views on Vision4Press platform.
Data correspond to usage on the plateform after 2015. The current usage metrics is available 48-96 hours after online publication and is updated daily on week days.
Initial download of the metrics may take a while.