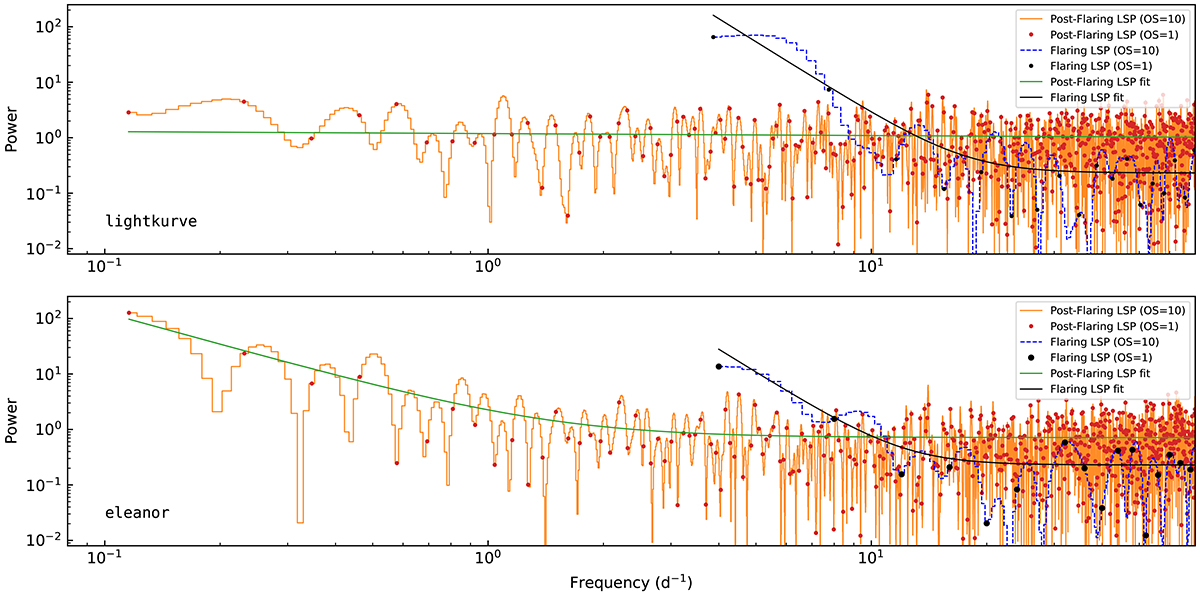
Fig. 4.
Download original image
LSP plots of flaring and post-flaring portions of first segment of Sector 42 LC. The upper plot shows LSP corresponding to the LC achieved with lightkurve, while the lower plot corresponds to the eleanor one. In these plots, the LSPs are plotted correspondingly to the over-samplings (OS) indicated. The normal LSPs with no over-sampling are over-plotted to demonstrate the unreliability of their fitting due to the scarcity of available data points. The LSP fits correspond to OS = 10.
Current usage metrics show cumulative count of Article Views (full-text article views including HTML views, PDF and ePub downloads, according to the available data) and Abstracts Views on Vision4Press platform.
Data correspond to usage on the plateform after 2015. The current usage metrics is available 48-96 hours after online publication and is updated daily on week days.
Initial download of the metrics may take a while.