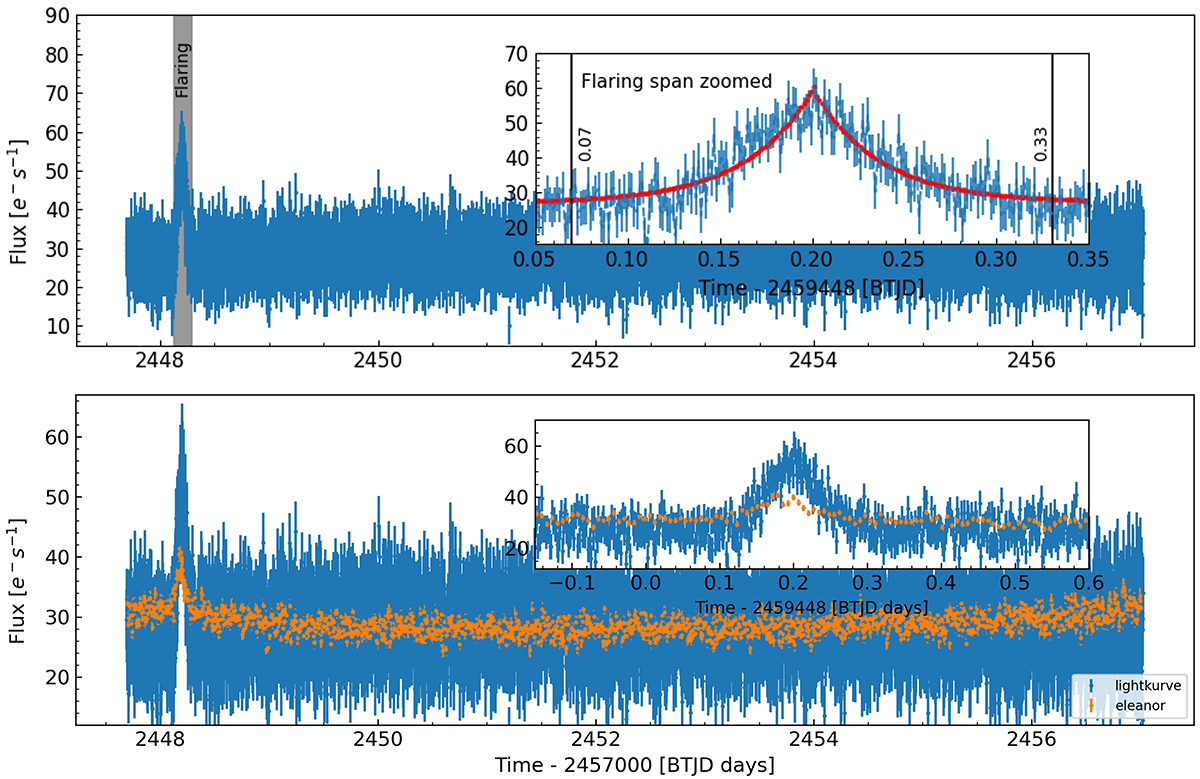
Fig. 2.
Download original image
Reduced LCs showing the fast variability in Sector 42. The upper plot includes the complete reduced LC using lightkurve, where the inset shows a zoomed-in view of the flare period. The red curve in the subplot is the model fitted by Eq. (1). The lower plot presents a comparison between the LCs produced using lightkurve and eleanor. The eleanor LC in this plot has been shifted down by 40 e− s−1. A zoomed-in view of the flare with the eleanor reduction is plotted in the inset.
Current usage metrics show cumulative count of Article Views (full-text article views including HTML views, PDF and ePub downloads, according to the available data) and Abstracts Views on Vision4Press platform.
Data correspond to usage on the plateform after 2015. The current usage metrics is available 48-96 hours after online publication and is updated daily on week days.
Initial download of the metrics may take a while.