Fig. A.1.
Download original image
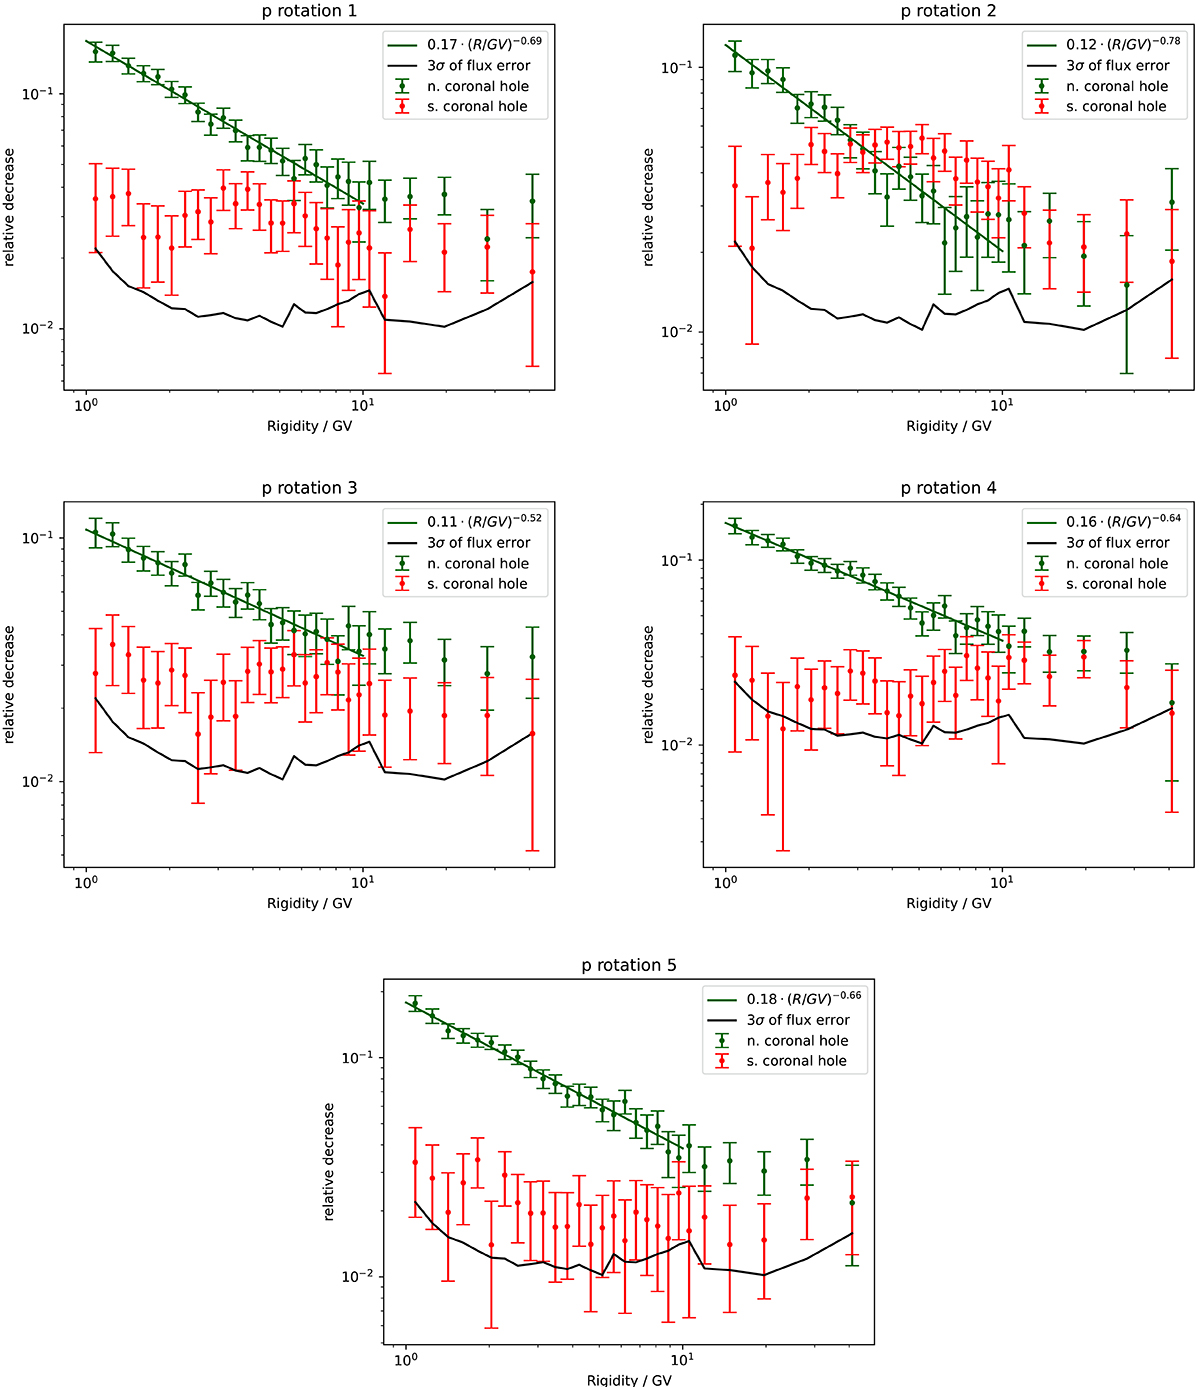
Relative proton amplitudes vs. rigidity for single solar rotations. The color coding shows the polarity of the CH responsible for the FD (green and red for positive and negative polarity, respectively). The relative amplitudes caused by the northern CH has been fitted by a power law (Eq. 3) in the rigidity range from 1-10 GV. The black lines show three times the average error of the fluxes in the analyzed time period of five solar rotations.
Current usage metrics show cumulative count of Article Views (full-text article views including HTML views, PDF and ePub downloads, according to the available data) and Abstracts Views on Vision4Press platform.
Data correspond to usage on the plateform after 2015. The current usage metrics is available 48-96 hours after online publication and is updated daily on week days.
Initial download of the metrics may take a while.