Fig. 7.
Download original image
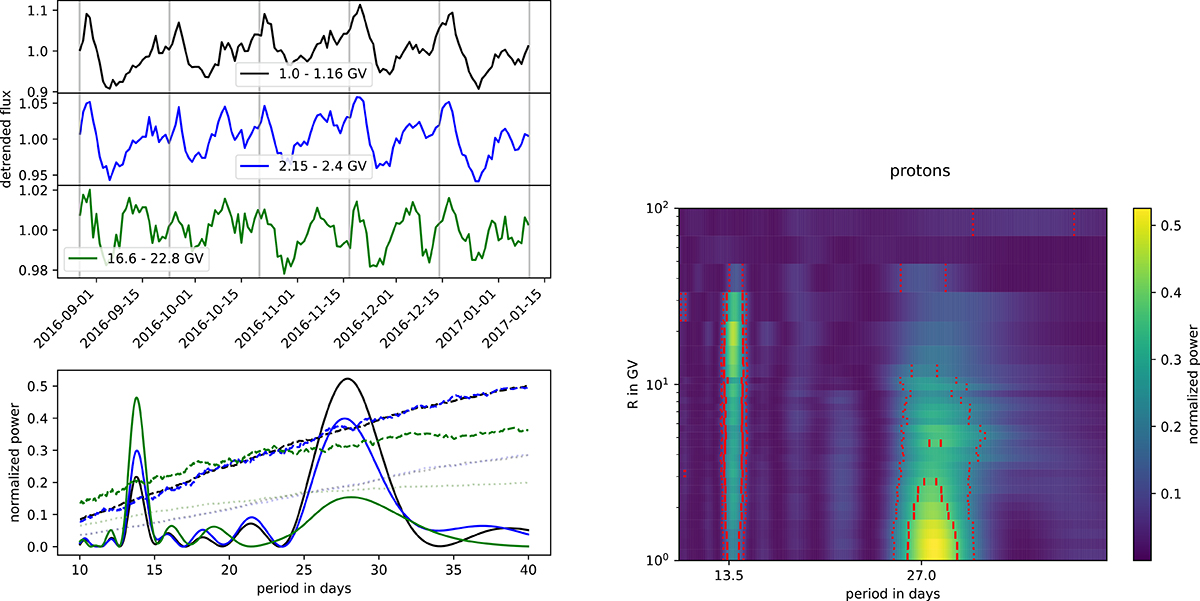
Relative proton flux for three rigidity bins (top three columns on the left). The lower-left panel gives the resulting normalized power according to Eq. (4). The dashed lines mark the respective corrected confidence levels and the dotted lines the uncorrected ones. Right: Color coding gives the normalized power for protons for all rigidity bins. Again, the dashed and dotted line mark the height at which the normalized power becomes significant for the corrected and uncorrected confidence level, respectively.
Current usage metrics show cumulative count of Article Views (full-text article views including HTML views, PDF and ePub downloads, according to the available data) and Abstracts Views on Vision4Press platform.
Data correspond to usage on the plateform after 2015. The current usage metrics is available 48-96 hours after online publication and is updated daily on week days.
Initial download of the metrics may take a while.