Fig. 1.
Download original image
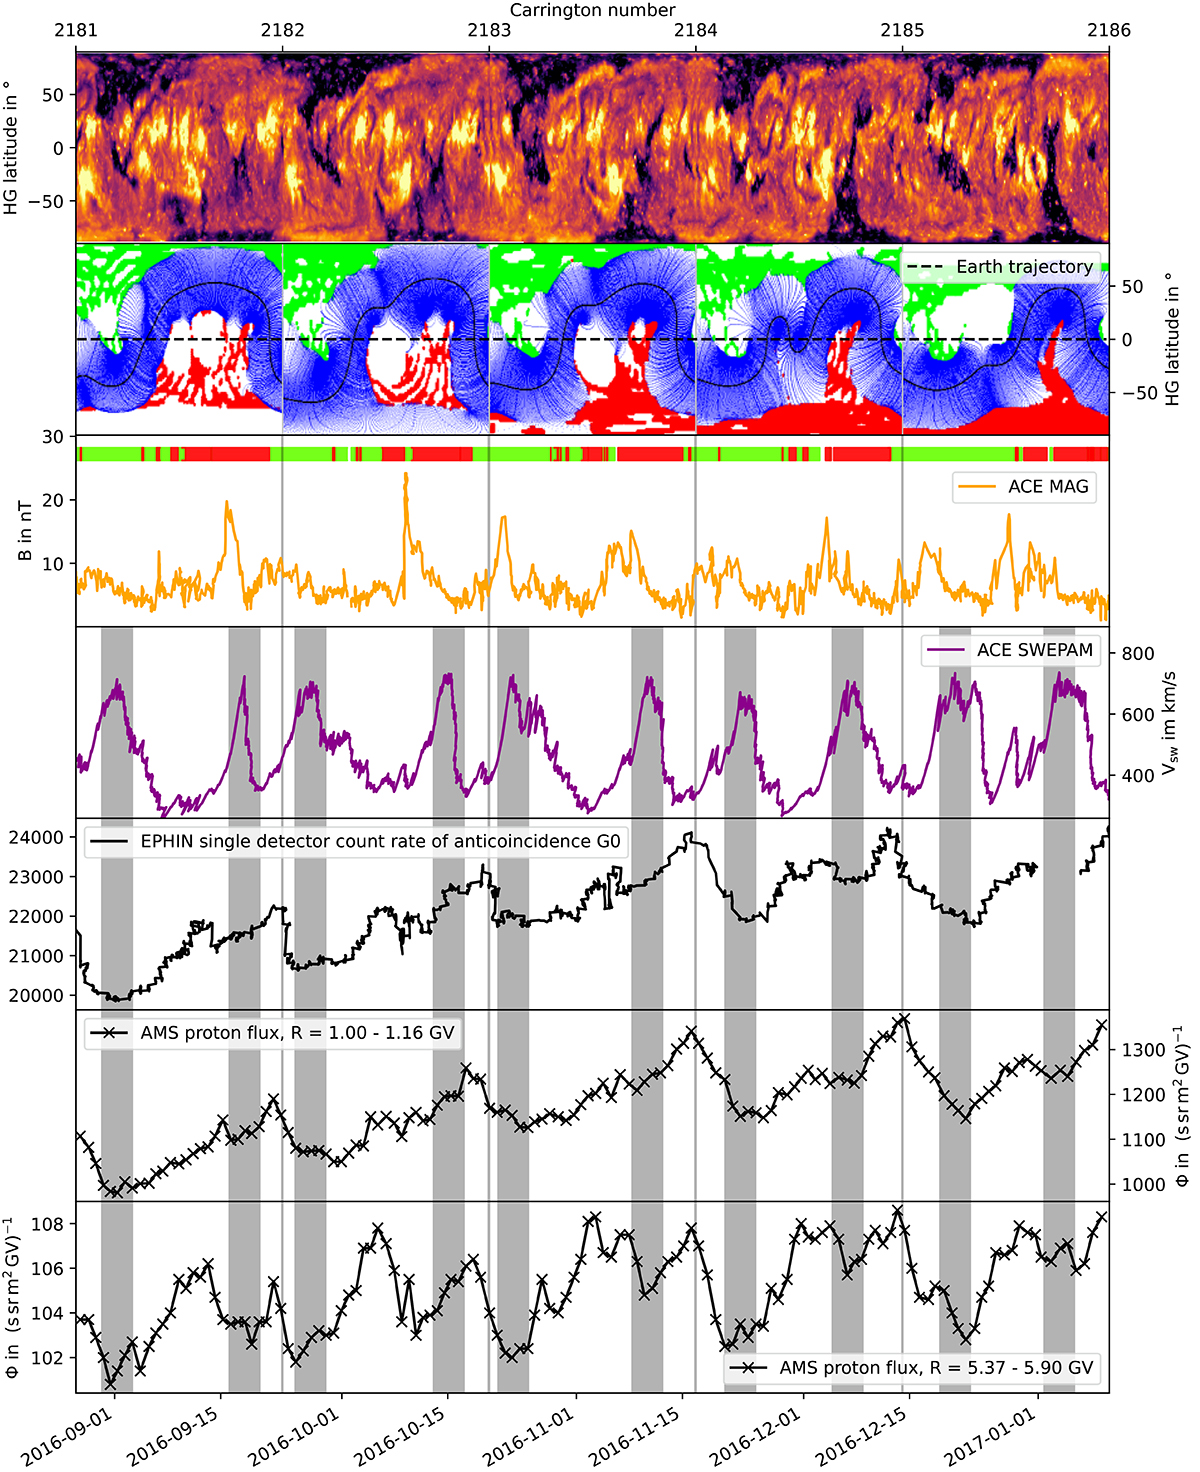
Comparison of remote sensing observation with the in situ data for Carrington rotation 2181.0 to 2185.0, from top to bottom: (1) EUV synoptic maps based on SDO/AIA full-disk images at a wavelength of 193 Å. (2) GONG maps, where positive and negative magnetic polarity is denoted by green and red color, respectively. (3) Hourly Advanced Composition Explorer (ACE) magnetic field magnitude and local polarity. (4) Hourly solar wind speed measured by ACE/SWEPAM. (5) Hourly count rate of EPHIN single detector counter of scintillator anticoincidence G0. (6) Daily AMS proton flux with a rigidity of 1.00–1.16 GV. (7) Daily AMS proton flux with a rigidity of 5.37–5.90 GV. Note that the remote sensing maps (panels 1 and 2) have been mirrored in order to have the time running from left to right and the in situ data (panels 3 to 7) are backmapped to 2.5 solar radii. The grey areas mark the peaks of the solar wind speed ± 2 days. We note that EPHIN and AMS-02 flux is anticorrelated to solar wind speed.
Current usage metrics show cumulative count of Article Views (full-text article views including HTML views, PDF and ePub downloads, according to the available data) and Abstracts Views on Vision4Press platform.
Data correspond to usage on the plateform after 2015. The current usage metrics is available 48-96 hours after online publication and is updated daily on week days.
Initial download of the metrics may take a while.