Fig. 3
Download original image
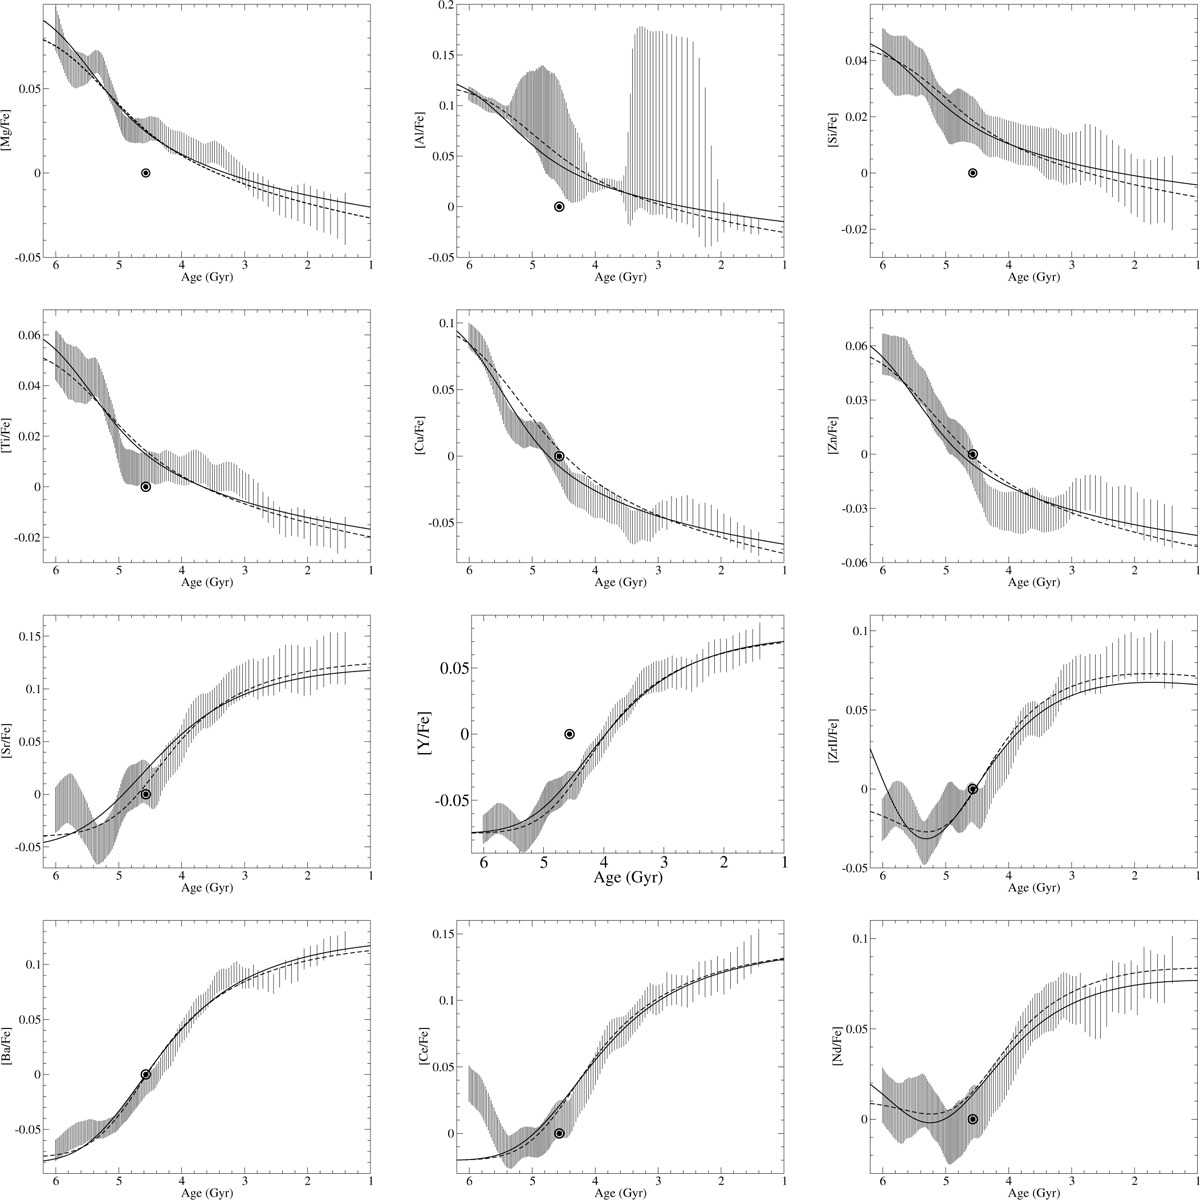
Mean abundance ratios of sample stars in age bins of 20 stars as a function of the average age of the stars in those bins. The grey areas represent the ±1σ errors on the mean abundance values. The upper row and the upper middle row provide the mean abundances of the Mg, Al, and Si α elements; and the Ti, Cu, and Zn iron-peak elements, respectively. The lower middle row and the lower row show the mean abundances of the Sr, Y, and Zr light; and the Ba, Ce, and Nd heavy s-process elements, respectively. The circles indicate the corresponding element abundances in the Sun. The dashed lines represent best-fit simulations of the mean abundance ratios with a chemical evolution model of a metal-rich gaseous disc with low initial surface density experiencing an infall of pristine gas (see Model A in Table 1). The continuous lines represent the best-fit simulations of the mean abundance ratios with a chemical evolution model of a metal-rich gaseous disc with a moderate initial surface density experiencing an infall of pristine gas (see Model B in Table 1).
Current usage metrics show cumulative count of Article Views (full-text article views including HTML views, PDF and ePub downloads, according to the available data) and Abstracts Views on Vision4Press platform.
Data correspond to usage on the plateform after 2015. The current usage metrics is available 48-96 hours after online publication and is updated daily on week days.
Initial download of the metrics may take a while.