Fig. 1
Download original image
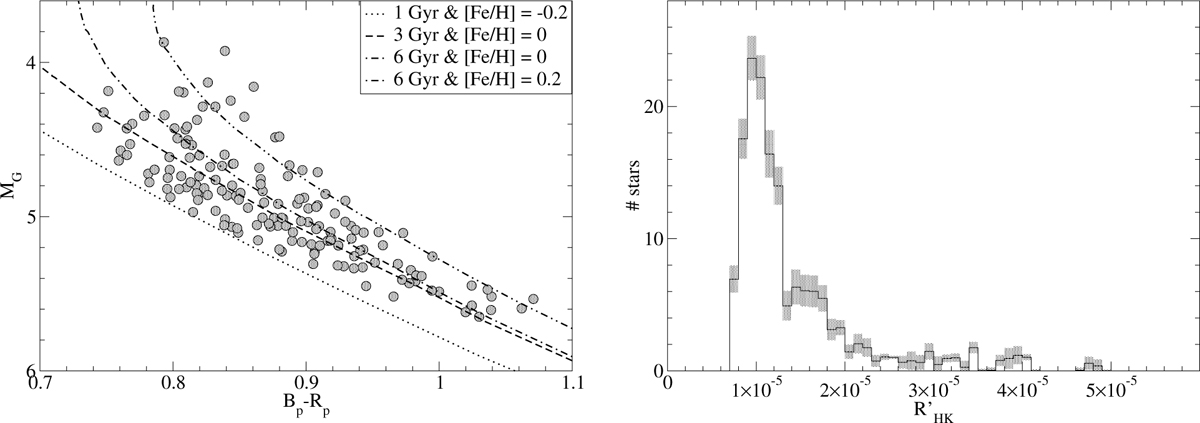
Evolutionary status and magnetic activity distribution of sample stars. Left: colour-magnitude diagram of sample stars compared with the PARSEC isochrones (Bressan et al. 2012) projected into the Gaia eDR3 photometric system (Evans et al. 2018). Right: mean ⟨![]() ⟩ index distribution of sample stars. The grey areas represent the ± 1σ envelopes of 1000 realisations of the
⟩ index distribution of sample stars. The grey areas represent the ± 1σ envelopes of 1000 realisations of the ![]() index distribution assuming a Gaussian distribution of the average ⟨
index distribution assuming a Gaussian distribution of the average ⟨![]() ⟩ index of each star around the value provided in the AMBRE-HARPS catalogue of
⟩ index of each star around the value provided in the AMBRE-HARPS catalogue of ![]() indices with the uncertainty given in the catalogue.
indices with the uncertainty given in the catalogue.
Current usage metrics show cumulative count of Article Views (full-text article views including HTML views, PDF and ePub downloads, according to the available data) and Abstracts Views on Vision4Press platform.
Data correspond to usage on the plateform after 2015. The current usage metrics is available 48-96 hours after online publication and is updated daily on week days.
Initial download of the metrics may take a while.