Open Access
Fig. 9.
Download original image
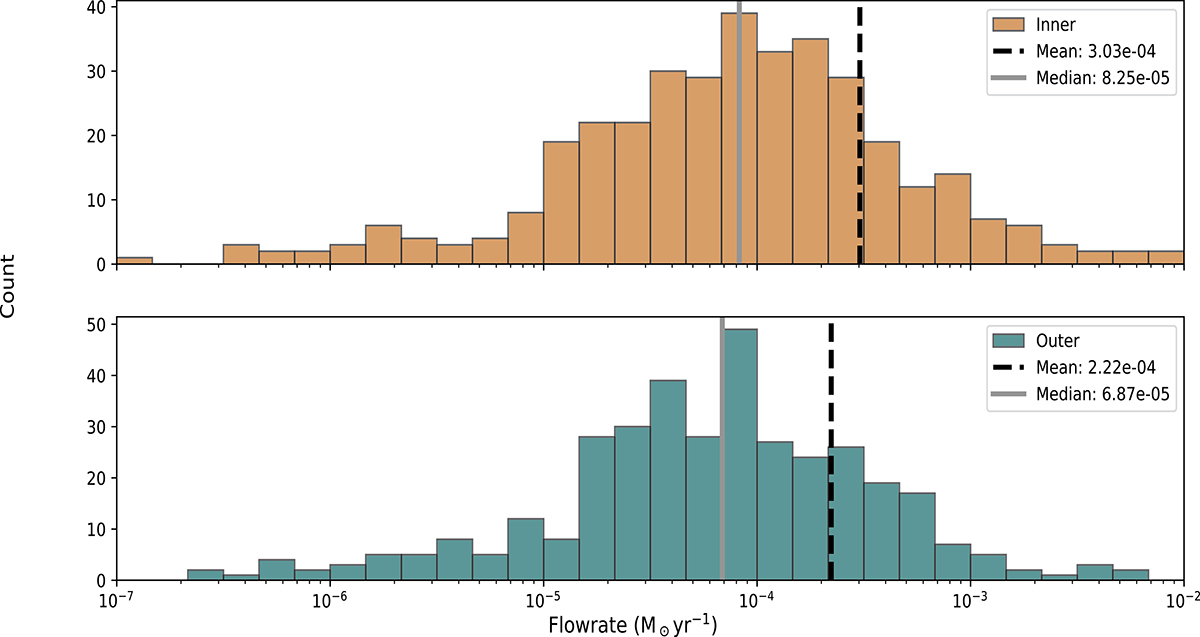
Histograms of the flow rate results in the context of offset from the core. The top panel shows the results from the inner regions and the bottom from those further from the core.
Current usage metrics show cumulative count of Article Views (full-text article views including HTML views, PDF and ePub downloads, according to the available data) and Abstracts Views on Vision4Press platform.
Data correspond to usage on the plateform after 2015. The current usage metrics is available 48-96 hours after online publication and is updated daily on week days.
Initial download of the metrics may take a while.