Fig. 5.
Download original image
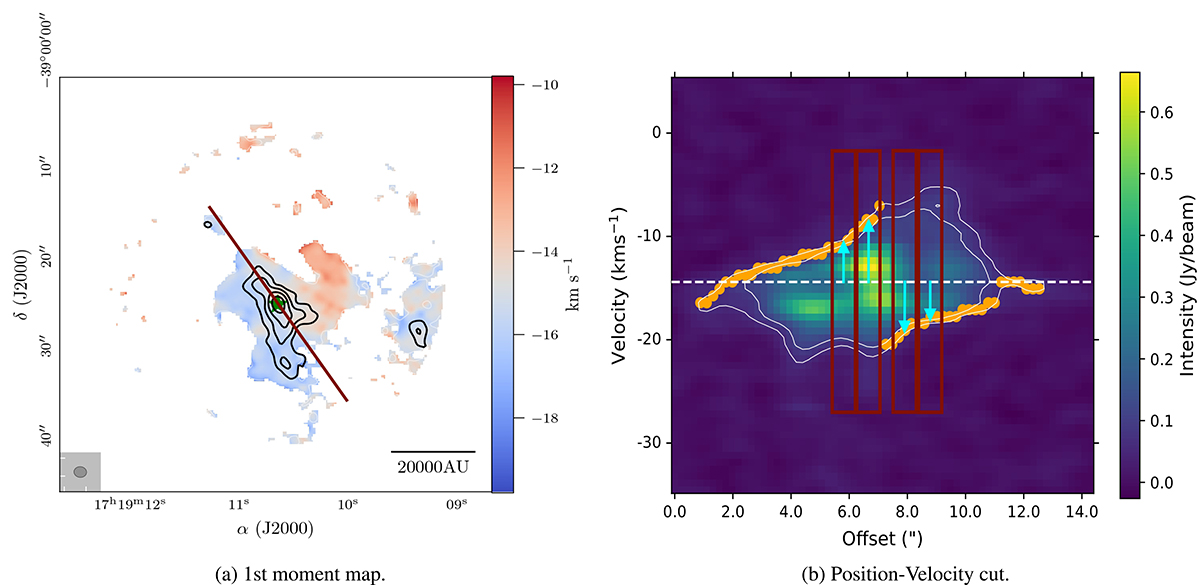
Velocity analysis of source AG348.5792–0.9197. (a): First-moment map of YSO source AG348.5792–0.9197 in H2CO (30, 3–20, 2). The position of the continuum peak flux density is shown by the green star, and continuum contours are shown in black (levels 3, 6, 9σcont). The red line indicates the axis along which the PV cut was taken. (b): PV cut with 3 and 5σline contours in white, and the vlsr of the region shown by the white dashed line. The orange points show the nearest pixels at the 3σline contours. The red boxes are examples of the areas where we estimate the flow rates across (∼1″). The peak flux density position of the continuum core is located at the centre of each axis.
Current usage metrics show cumulative count of Article Views (full-text article views including HTML views, PDF and ePub downloads, according to the available data) and Abstracts Views on Vision4Press platform.
Data correspond to usage on the plateform after 2015. The current usage metrics is available 48-96 hours after online publication and is updated daily on week days.
Initial download of the metrics may take a while.