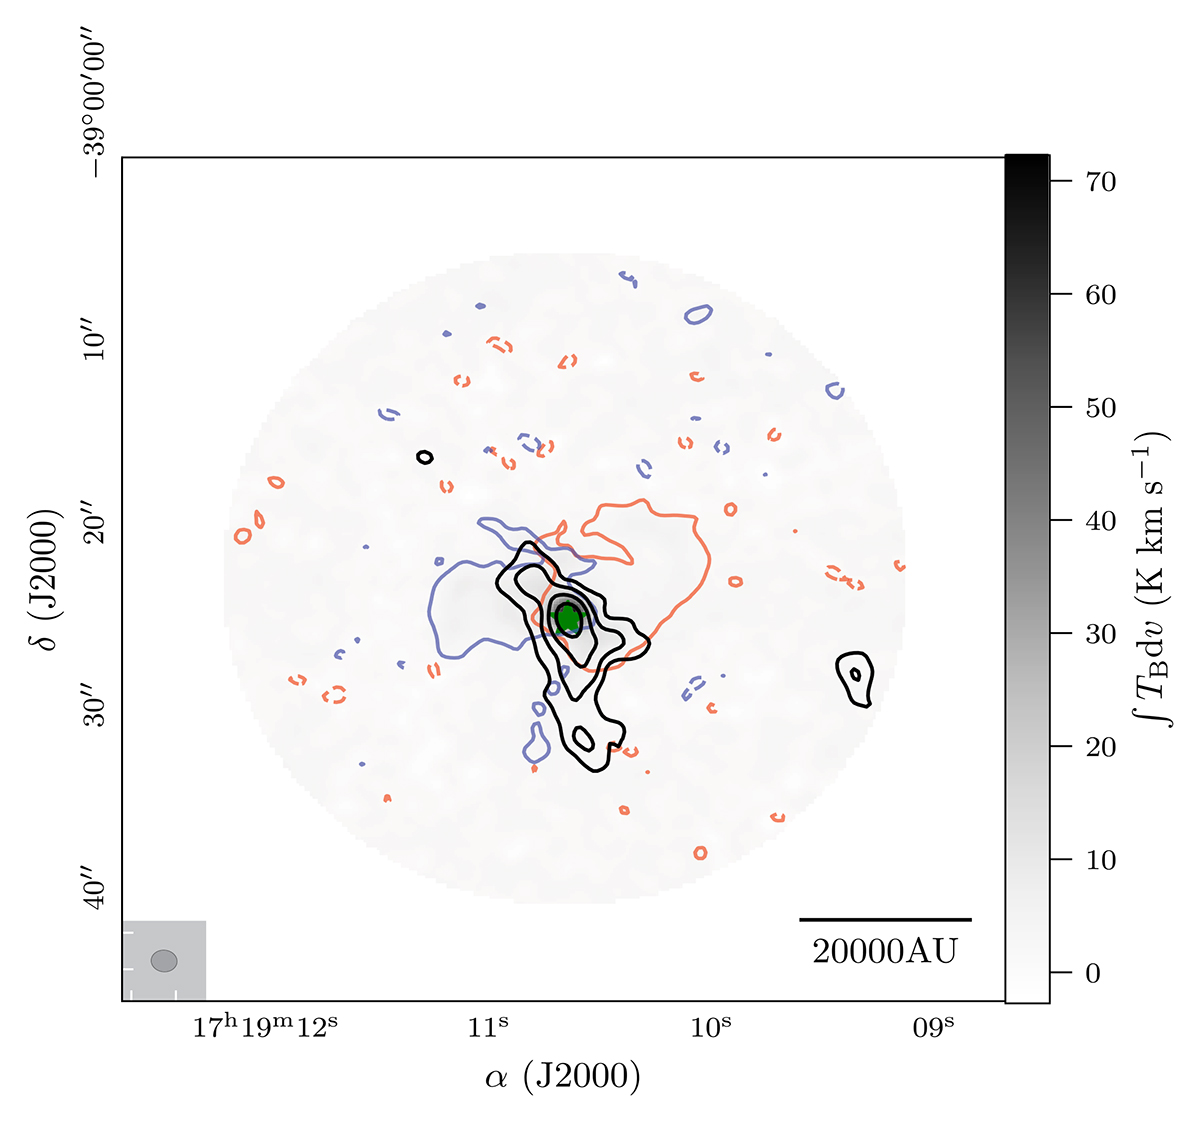
Fig. 4.
Download original image
Zeroth moment map of SO (65–54) in grey-scale for source AG348.5792–0.9197 overlaid with continuum contours in black (levels 3, 6, 9σcont). A green star to show the peak intensity position of the core. Red and blue contours show the ‘wings’ of the spectral line emission, from 3 to 20 km s−1 either side, with respect to the region velocity of rest.
Current usage metrics show cumulative count of Article Views (full-text article views including HTML views, PDF and ePub downloads, according to the available data) and Abstracts Views on Vision4Press platform.
Data correspond to usage on the plateform after 2015. The current usage metrics is available 48-96 hours after online publication and is updated daily on week days.
Initial download of the metrics may take a while.