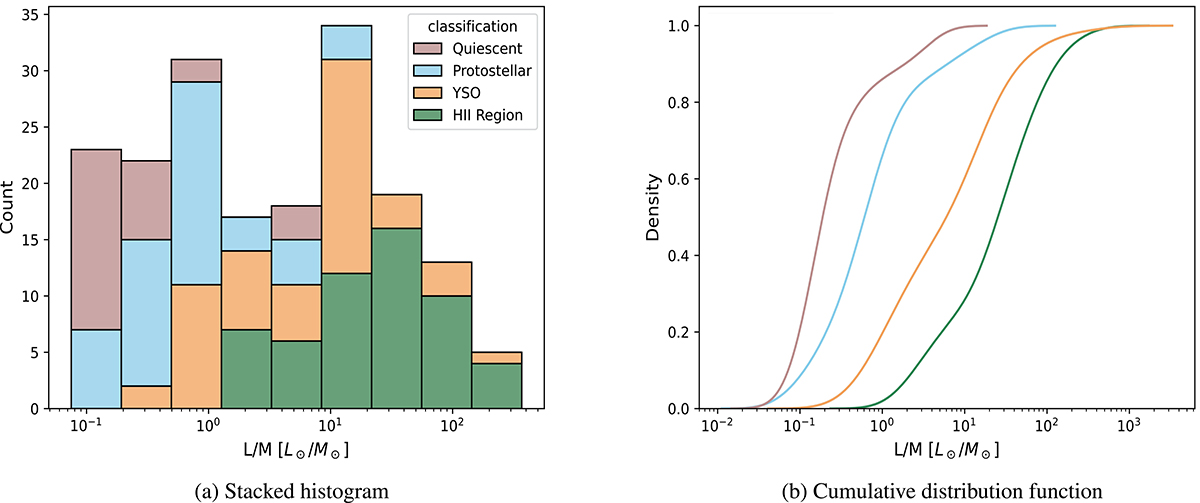
Fig. 2.
Download original image
Colour-coding for both figures is on evolutionary stage, legend shown in panel a. These plots show the sample of 17 quiescent, 23 protostellar, 22 YSO, and 25 HII regions. (a) Stacked histogram distribution of the luminosity-to-mass ratio for the regions in the ALMAGAL sub-sample being used for this work. (b) Individual cumulative distribution functions (CDF) of regions in each evolutionary stage, generated from kernel density estimates (KDEs) of the data shown in (a).
Current usage metrics show cumulative count of Article Views (full-text article views including HTML views, PDF and ePub downloads, according to the available data) and Abstracts Views on Vision4Press platform.
Data correspond to usage on the plateform after 2015. The current usage metrics is available 48-96 hours after online publication and is updated daily on week days.
Initial download of the metrics may take a while.