Open Access
Fig. 11.
Download original image
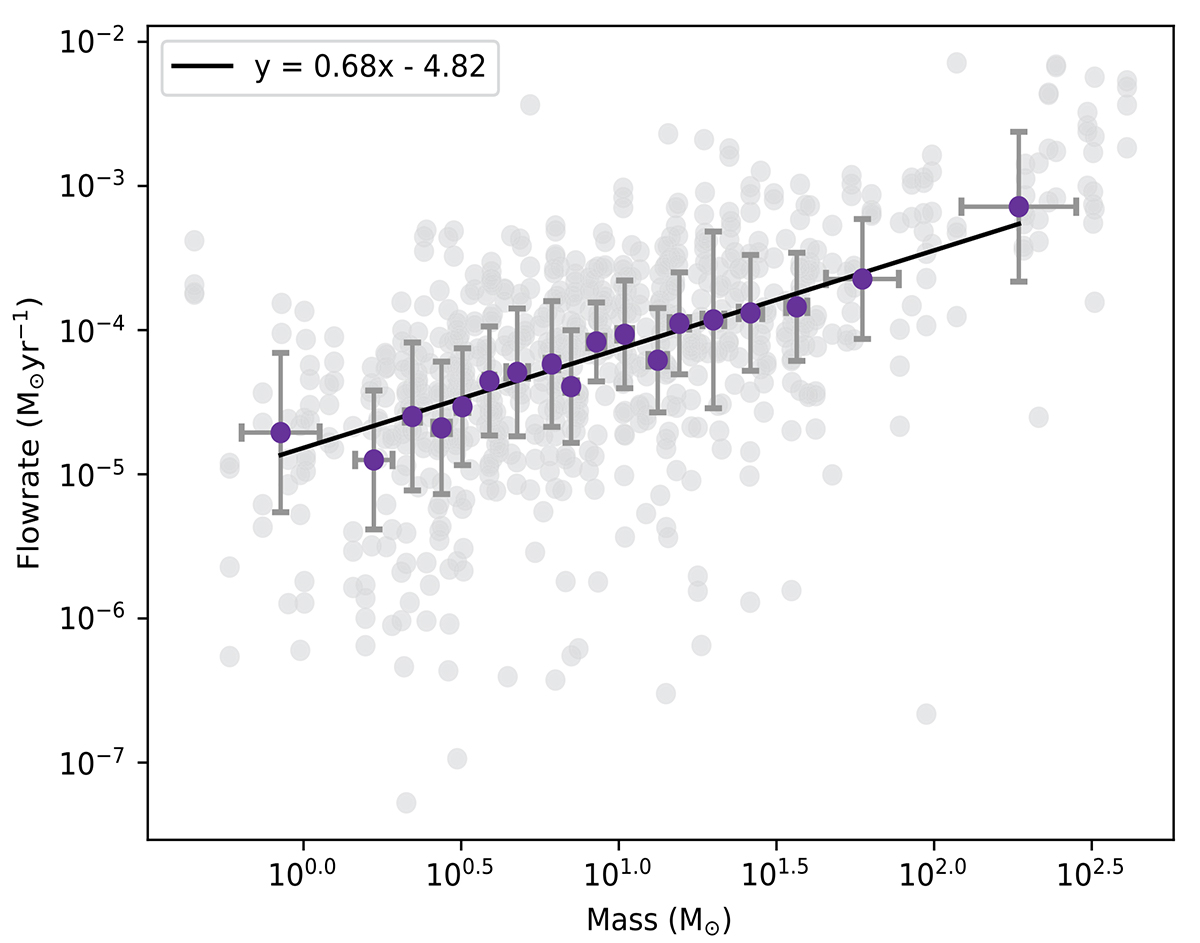
Scatter plot of the results of the whole sample showing flow rate vs. core mass in grey. The purple points are the average flow rate/mass values per bin, with the associated errors. Here, each bin contains the same number of cores. A line of best fit is shown in black.
Current usage metrics show cumulative count of Article Views (full-text article views including HTML views, PDF and ePub downloads, according to the available data) and Abstracts Views on Vision4Press platform.
Data correspond to usage on the plateform after 2015. The current usage metrics is available 48-96 hours after online publication and is updated daily on week days.
Initial download of the metrics may take a while.